ZingChart jQuery
Less code. More win.
ZingChart jQuery is a wrapper for the [ZingChart charting library](http://www.zingchart.com/) that allows for jQuery-style use of the [**88** different API methods](#methods) and [**81** different API events](#events) that ZingChart has to offer. It's designed to allow maximum use of the various features with the simplest and most jQuery-esque syntax possible.
Intro
Before we get started with this wrapper, it'd be a good idea to familiarize yourself with the ZingChart library. There's even a tutorial for creating your first chart with ZingChart. It should get you up to speed on how this library works.
Looking for more info? Check out any of the below tutorials to get up to speed on the ZingChart library or dig into our docs pages.
Tutorials
- Your First Chart
- Basic Scale Configuration
- Improving Data Indicators
- Adding Style
- Calling Attention
- Customizing the Context-Menu
- Using Data From a Database
Basics
Step One is to make sure you have jQuery loaded. This wrapper won't work without it.
Step Two is to have the ZingChart library loaded. We suggest you use our new, fandangled CDN to keep up to date with the latest build.
Step Three is to have this library loaded. Again, in order to stay up to date with the latest build, we suggest using our CDN.
Here's what should be in the <head> once you're done.
All good? Time to make some sweet charts.
The ZingChart jQuery wrapper works just like normal jQuery. Each method or event is tacked on to the standard jQuery selector method. All methods should be placed inside a $(document).ready() call to ensure the DOM is fully loaded. Here's an example of creating a ZingChart object on a div with an ID of "myChart":
For the sake of brevity, the rest of the examples will omit the
$(document).ready()wrapper. That being said, you still need to include it when using this library.
All of the methods which take an object as a parameter can have it passed through directly or by reference. Both are equivalent.
Directly
;Reference
var myData = "type": "bar" "series": "values": 3792 ; ;Woohoo! Congrats! You've just made your first ZingChart. Pretty straightforward, isn't it? Now we get into the nitty gritty of the API: how to make your chart do stuff.
Chaining
One of the more user-friendly aspects of jQuery is the chaining of functions, allowing for users to specify the target once but call multiple functions that affect it. This wrapper supports chaining for any methods or events that return a jQuery object. For example, say you want to set a chart to the 3D view and resize it. Instead of calling each method on the chart separately, you could chain them like this:
;$("#myChart") is now set to a 3D view and resized in just one line of code! Pat yourself on the back for saving time by using chaining. You're a rockstar!
**An Important Note**: many of the event functions may be very similar in name to the method functions and vice versa. This is intentional. The differentiation between the method functions and the event functions is that the ***method*** functions always start with a ***verb***: the action they're performing, while the ***event*** functions always start with a ***noun***: the object they're watching.
Examples
-
Chart Manipulation: Using Methods and Events Together
Check out this example to see how to make a chart with lots of plots into an interactive and much more legible chart. Edit in JSFiddle

-
Chart to DOM: Manipulating the DOM with Events
Learn how to manipulate the DOM through the use of ZingChart jQuery events. Edit in JSFiddle

-
DOM to Chart: Manipulating the Chart with Methods
This is a great first example if you're looking to learn how to integrate ZingChart jQuery methods with standard DOM input elements. Edit in JSFiddle

-
AJAX Data: Using Asynchronous Data with your Chart
No need to load your data at once. Check out this example to see how to get started with AJAX and the ZingChart jQuery wrapper. Edit in JSFiddle

-
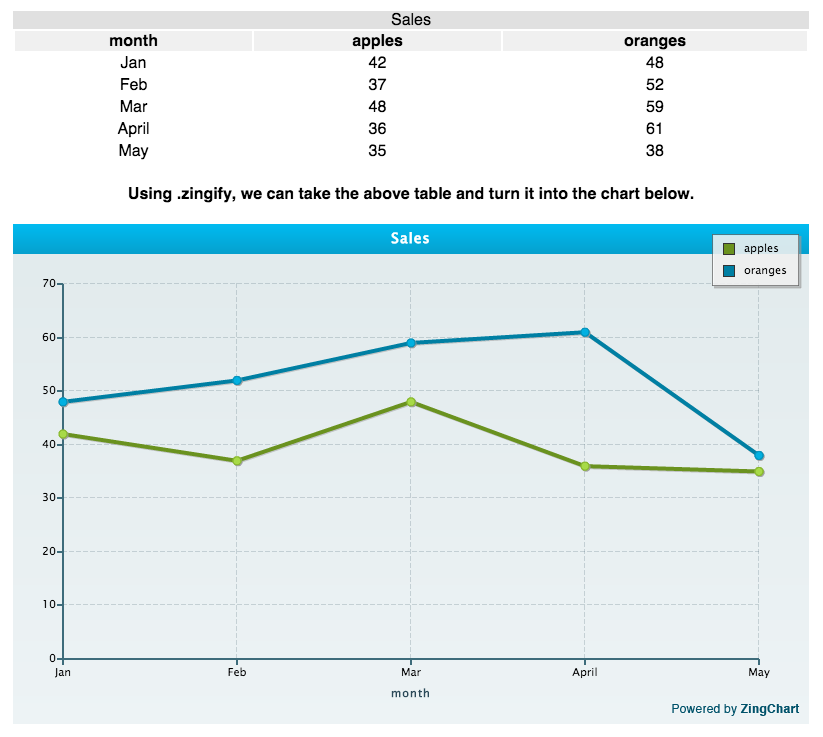
Table to Chart: Using the Zingify Tool
Take your well-formed HTML tables and turn them into snazzy charts with ease. Edit in JSFiddle
Questions?
Check out out extensive documentation below or feel free to email us at support@zingchart.com if you have any questions.
# Methods[](#methods) # ## Rendering ##
.zingchart( object )
Creates a new ZingChart object
| Values | Type | Details |
|---|---|---|
| Parameter | Object | ZingChart Object |
| Return | jQuery | jQuery Object |
Rendering a chart
;## Data Manipulation ## #### .addNode( object ) #### Adds a node to an existing plot
| Values | Type | Details |
|---|---|---|
| Parameter | Object | Node Object |
| Return | jQuery | jQuery Object |
;#### .addPlot( object ) #### Adds a new plot to an exising chart
| Values | Type | Details |
|---|---|---|
| Parameter | Object | Plot Object |
| Return | jQuery | jQuery Object |
;#### .appendSeriesData( object ) #### Appends data to the existing series. Can be used on a single plot or the whole series. Note that the value arrays sent do not concatenate the existing ones.
| Values | Type | Details |
|---|---|---|
| Parameter | Object | Series Object |
| Return | jQuery | jQuery Object |
;#### .appendSeriesValues( object ) #### Appends data to the end of a plot. Can be used on a single plot or the whole series.
| Values | Type | Details |
|---|---|---|
| Parameter | Object | Series Object |
| Return | jQuery | jQuery Object |
;#### .getSeriesData( object ) #### Returns the series data. If a series object is passed through, the data for that series is returned. If no argument is passed through, the data for every series of the chart is returned.
| Values | Type | Details |
|---|---|---|
| Parameter | Object (OPTIONAL) | Series Object |
| Return | Object | Series Object |
var myData = ; // myData = the series data for plot[1] of the chart var allData = ; // allData = the series data for all plots of the chart#### .getSeriesValues( object ) #### Returns the series values. If a series object is passed through, the values for that series are returned. If no argument is passed through, the values for every series of the chart are returned concatenated in order from the first plot to the last plot.
| Values | Type | Details |
|---|---|---|
| Parameter | Object (OPTIONAL) | Series Object |
| Return | Object | Series Object |
var myValues = ; // myValues = the series values for plot[0] of the chart var allValues = ; // allValues = the series values for all plots of the chart#### .modifyPlot( object ) #### Modifies an existing plot on the chart specified by **plotindex**.
| Values | Type | Details |
|---|---|---|
| Parameter | Object | Plot Object |
| Return | jQuery | jQuery Object |
;#### .removeNode( object ) #### Removes a node specified by **plotindex** and **nodeindex**.
| Values | Type | Details |
|---|---|---|
| Parameter | Object | Node Object |
| Return | jQuery | jQuery Object |
;#### .removePlot( object ) #### Removes a plot specified by **plotindex**.
| Values | Type | Details |
|---|---|---|
| Parameter | Object | Plot Object |
| Return | jQuery | jQuery Object |
;#### .set3dView( object ) #### Sets the new 3D parameters for the view. This overrides the settings from the **3d-aspect** attribute of the chart.
| Values | Type | Details |
|---|---|---|
| Parameter | Object | 3D View Object |
| Return | jQuery | jQuery Object |
;#### .setNodeValue( object ) #### Changes the value of a single node specified via **plotindex** and **nodeindex** to the new **value**.
| Values | Type | Details |
|---|---|---|
| Parameter | Object | Node Object |
| Return | jQuery | jQuery Object |
;#### .setSeriesData( object ) #### Replaces the series data. It can be used on one plot or the whole series depending on if **plotindex** is set.
| Values | Type | Details |
|---|---|---|
| Parameter | Object | Series Object |
| Return | jQuery | jQuery Object |
Setting the series data for a single plot:
;Setting the series data for all plots:
;#### .setSeriesValues( object ) #### Replaces the series values. It can be used on one plot or the whole series depending on if **plotindex** is set.
| Values | Type | Details |
|---|---|---|
| Parameter | Object | Series Object |
| Return | jQuery | jQuery Object |
Setting the series values for a single plot:
;Setting the series values for all plots:
;## Export ### #### .exportData() #### Exports the current data for the chart. This only works if the **exportdataurl** is set in the [render options](http://www.zingchart.com/docs/reference/zingchart-object/#zingchart__render).
| Values | Type | Details |
|---|---|---|
| Parameter | ||
| Return | jQuery | jQuery Object |
;//Assuming the exportdataurl is set in the render options, the current data for the chart will be exported to that url.#### .getImageData( string ) #### Returns a Base64 encoded image string of the current chart.
| Values | Type | Details |
|---|---|---|
| Parameter | String | "png", "jpg", "bmp" (only if rendering in Flash) |
| Return | jQuery | jQuery Object |
; // or... ; // or (if you're rendering via Flash)... ;#### .print() #### Creates a printable version of the chart and attempts to print it.
| Values | Type | Details |
|---|---|---|
| Parameter | ||
| Return | jQuery | jQuery Object |
// Results in the printer dialog opening on the page;#### .saveAsImage() #### Produces an image of the graph. This will only work if the **exportimageurl** is set in the [render options](http://www.zingchart.com/docs/reference/zingchart-object/#zingchart__render).
| Values | Type | Details |
|---|---|---|
| Parameter | ||
| Return | jQuery | jQuery Object |
// Assuming the exportimageurl is set in the render options, an image of the current chart will be exported to that url.;## Feed (Real-time Data) ## #### .clearFeed() #### Clears the current chart and starts the feed anew.
| Values | Type | Details |
|---|---|---|
| Parameter | ||
| Return | jQuery | jQuery Object |
;#### .getInterval() #### Returns the current interval value set on the feed.
| Values | Type | Details |
|---|---|---|
| Parameter | ||
| Return | Number | Seconds (1,2,..) or Miliseconds (100,200,...) |
var myInterval = ;#### .setInterval( number ) #### Sets the feed update interval on a feed graph.
| Values | Type | Details |
|---|---|---|
| Parameter | Number | Seconds (1,2,...) or Miliseconds (100,200,...) |
| Return | jQuery | jQuery Object |
;// Sets the feed update interval to 500ms (1/2 sec)#### .startFeed() #### Starts the data feed of the chart.
| Values | Type | Details |
|---|---|---|
| Parameter | ||
| Return | jQuery | jQuery Object |
;#### .stopFeed() #### Stops the data feed of the chart.
| Values | Type | Details |
|---|---|---|
| Parameter | ||
| Return | jQuery | jQuery Object |
;## Graph Information ## #### .getChartType( object ) #### Returns the chart's type. If a **graphid** is passed, it will return the chart type for the specified chart. If the chart is has multiple charts inside it (i.e. a graphset) and no object is passed specifying which graphid to get, the method returns the chart type of the first (index 0) chart in the graph set.
| Values | Type | Details |
|---|---|---|
| Parameter | Object (OPTIONAL) | Graph Object |
| Return | String | The chart type in lowercase ("line", "pie", "area",...) |
var myType = ;// myType = the type of the chart at #$("#myChart") var indexOneType = ;// indexOneType = the type of the chart at index 1 of #$("#myChart")#### .getData() #### Returns the entire JSON for the chart. All of it. Every single nugget of info.
| Values | Type | Details |
|---|---|---|
| Parameter | ||
| Return | Object | Chart Data Object |
#### .getEditMode() #### Returns 'true' if the user is in edit more for the chart or 'false' if not.
| Values | Type | Details |
|---|---|---|
| Parameter | ||
| Return | Boolean | true if in edit more, false if not |
if // If we were in edit more on the chart, the alert would fire.#### .getGraphLength() #### Returns the number of graph objects in the chart.
| Values | Type | Details |
|---|---|---|
| Parameter | ||
| Return | Number | 1,2,... |
var numberOfGraphs = ; // numberOfGraphs = the number of graph objects in the chart#### .getNodeLength( object ) #### Returns the number of nodes in a plot specified by **plotindex**. If no object is passed, the function returns the number of nodes in the 0 index plot.
| Values | Type | Details |
|---|---|---|
| Parameter | Object (OPTIONAL) | Plot Object |
| Return | Number | 1,2,... |
var numberOfNodes = ; // numberOfNodes = the number of nodes in the 0 index plot var nodesInPlot = ; // nodesInPlot = the number of nodes in the plot at index 1#### .getNodeValue( object ) #### Returns the value of the node specified by **plotindex** and **nodeindex**.
| Value | Type | Details |
|---|---|---|
| Parameter | Object | Node Object |
| Return | Number | 1,2,... |
var myValue = ;#### .getObjectInfo( object ) #### Returns various attributes for specific chart elements (graph, plotarea, scale, plot, node). Depending on the object passed, a subset of the following attributes will be returned: ```x, y, width, height, lineColor, lineWidth, borderColor, borderWidth, backgroundColor1, backgroundColor2, text, values, minValue, maxValue, step, stepSize```
| Value | Type | Details |
|---|---|---|
| Parameter | Object | Info Object |
| Return | Object | Dependent on targeted object |
; // This would return all the object info available for the graph object.#### .getPlotLength( object ) #### Returns the number of plots in a given graph. If **graphid*** is specified, the number of plots for that graph are returned.
| Value | Type | Details |
|---|---|---|
| Parameter | Object (optional) | Graph ID Object |
| Return | Number | 1,2,... |
var myPlotLength = ; // myPlotLength would then equal the number of plots in $("#myChart")#### .getPlotValues( object ) #### Returns the value of the plot specified by **plotindex**.
| Value | Type | Details |
|---|---|---|
| Parameter | Object | Plot Object |
| Return | Array | ex: [12,23,45] |
var myPlotValues = ; // myPlotValues = the array of values for the plot at index 0.#### .getRender() #### Returns the render mode for the chart.
| Value | Type | Details |
|---|---|---|
| Parameter | ||
| Return | String | "svg", "canvas", "vml" |
var myRenderMode = ; // myRenderMode = the render more of $("#myChart")#### .getRules( object ) #### Returns an array containing the ids of the existing rules in the chart, specified by **plotindex**.
| Value | Type | Details |
|---|---|---|
| Parameter | Object | Plot Object |
| Return | Array | ["rule1", "rule2"] |
var myRules = ; myRules = the rules for the plot at index 0#### .getVersion() #### Returns the version of the library you're currently running. This is usefulf for debugging and good information to provide if you need to contacting support.
| Value | Type | Details |
|---|---|---|
| Parameter | ||
| Return | String | ex: "0.141015pre" |
var myVersion = ; // myVersion = the version of the library you're currently running.#### .getXYInfo( object ) #### Returns various scale and node related information based on x and y positions in the chart. The returned data is an array of object holding information relative to key scales, value scales, and node proximity.
| Value | Type | Details |
|---|---|---|
| Parameter | Object | XY Coords. |
| Return | Array | [Object1, Object2, ...] |
var myXYInfo = ; // myXYInfo = an array of information relative to the XY coordinates.## Graph Manipulation ## #### .addScaleValue( object ) #### Adds a new scale value on the chart.
| Value | Type | Details |
|---|---|---|
| Parameter | Object | Scale Object |
| Return | jQuery | jQuery Object |
;#### .destroy() #### Destroys the chart, removing the associated DOM nodes and events. This is the recommended way to remove a chart from a page.
| Value | Type | Details |
|---|---|---|
| Parameter | ||
| Return | jQuery | jQuery Object |
; // ZingChart jQuery Wrapper uses 'destroy'. It's super effective!#### .loadNewData( string ) #### Loads a new JSON packet from a URL.
| Value | Type | Details |
|---|---|---|
| Parameter | String | 'newjson.php', 'somedata.php', etc. |
| Return | jQuery | jQuery Object |
;#### .modify( object ) #### Modifies any part of the current graph that you specify in the passed object.
| Value | Type | Details |
|---|---|---|
| Parameter | Object | Modify Data Object |
| Return | jQuery | jQuery Object |
; // The title of $("#myChart") is now "Supermodified" and the subtitle is now "by Amon Tobin"#### .reloadChart( object ) #### If an object is passed through specifying the **graphid** of a graph, only that graph will be reloaded. If no object is passed through, the entire chart is reloaded.
| Value | Type | Details |
|---|---|---|
| Parameter | Object (optional) | Graphset Object |
| Return | jQuery | jQuery Object |
Reloading the entire chart.
;Reloading a single graph of the chart.
;#### .removeScaleValue( object ) #### Removes a value from the scale specified by the **scale** and the **nodeindex**.
| Value | Type | Details |
|---|---|---|
| Parameter | Object | Scale Object |
| Return | jQuery | jQuery Object |
; // The scale value at index 4 on the x-axis has now been removed.#### .resizeChart( object ) #### Resizes the chart according to new dimensions set by the **width** and **height**. For pixel-based widths and heights, you can just use a number (i.e. 600 instead of "600px"). For percentages, you'll need to use a string (i.e. "100%").
| Value | Type | Details |
|---|---|---|
| Parameter | Object | Size Object |
| Return | jQuery | jQuery Object |
; // Wha-Bam! Your chart is now 600px wide and 400px tall. #### .setData( object ) #### Takes a full JSON packet to replace the current one. Like the .zingchart() method, you can pass the object through directly or by reference.
| Value | Type | Details |
|---|---|---|
| Parameter | Object | Data Object |
| Return | jQuery | jQuery Object |
;#### .update() #### Flushes and applies all queued data manipulation changes set via API calls.
| Value | Type | Details |
|---|---|---|
| Parameter | ||
| Return | jQuery | jQuery Object |
;## History ## #### .goBack() #### Goes to the previous page in the chart history. This is very useful for navigating drilldown charts.
| Value | Type | Details |
|---|---|---|
| Parameter | ||
| Return | jQuery | jQuery Object |
;#### .goForward() #### Goes forward one page in the chart history. This is very useful for navigating drilldown charts.
| Value | Type | Details |
|---|---|---|
| Parameter | ||
| Return | jQuery | jQuery Object |
;## Interactive ## #### .addNodeIA( object ) #### Turns on the ability to add a node to the selected plot through clicking on the graph. An object argument need only be passed if you wish to 1) specify a specific graph in the graph set for which you wish to turn on interactive node adding or 2) in the case of a bubble graph which you pass through the object with "size": number where number is the size of the added node(s).
| Value | Type | Details |
|---|---|---|
| Parameter | Object (optional) | Added Node Object |
| Return | jQuery | jQuery Object |
For a non-bubble graph
;For a bubble graph
;#### .enterEditMode( object ) #### Turns on interactive mode, allowing the selection of a node or plot by clicking on it. The object need only be passed through if you wish you specify a graph in the graphset for which you wish to turn on edit mode.
| Value | Type | Details |
|---|---|---|
| Parameter | Object (optional) | Graph ID |
| Return | jQuery | jQuery Object |
;#### .exitEditMode( object ) #### Deselects the previously selected plot or node when interactive mode is on and exits interactive mode. The object need only be passed through if you wish to specify a graph in the graphset for which you wish to turn off edit mode.
| Value | Type | Details |
|---|---|---|
| Parameter | Object (optional) | Graph ID |
| Return | jQuery | jQuery Object |
;#### .removeNodeIA( object ) #### Removes a node selected in interactive mode. The object need only be passed through if you wish to specify a graph in the graphset for which you wish to remove a selected node.
| Value | Type | Details |
|---|---|---|
| Parameter | Object (optional) | Graph ID |
| Return | jQuery | jQuery Object |
;#### .removePlotIA( object ) #### Removes a plot selected in interactive mode. The object need only be passed through if you wish to specify a graph in the graphset for which you wish to remove a selected plot.
| Value | Type | Details |
|---|---|---|
| Parameter | Object (optional) | Graph ID |
| Return | jQuery | jQuery Object |
;## Notes ##
Requires the zingchart-html5-api-annotations-min.js module
.addNote( object )
Adds a note to a chart. The id of the note allows it to be updated or removed later.
| Value | Type | Details |
|---|---|---|
| Parameter | Object | Note Object |
| Return | jQuery | jQuery Object |
;#### .removeNote( string OR array) #### Removes a note, specified by **id** from a chart. If you wish to remove a single note, pass just the **id** of that note as a string. If you wish to remove multiple notes, pass an array of the **ids** of the notes you wish to remove.
| Value | Type | Details |
|---|---|---|
| Parameter | String OR Array | Note Name or Note Array |
| Return | jQuery | jQuery Object |
Removing a single note
;Removing multiple notes
;#### .updateNote( object ) #### Updates an existing note specified by the **id** of the passed note object. The note's position can be moved, the type can be changed, the style can be modified, and much more.
| Value | Type | Details |
|---|---|---|
| Parameter | Object | Node Object |
| Return | jQuery | jQuery Object |
;## Objects ## #### .addObject( object ) #### Adds one or more objects (labels or shapes) on the chart. Single objects are passed through within the **data** object. Multiple objects are passed through as an array of objects within the **data** object.
| Value | Type | Details |
|---|---|---|
| Parameter | Object | Shape/Label Object |
| Return | jQuery | jQuery Object |
Adding a single object
;Adding multiple objects
#### .removeObject( object ) #### Removes one or more objects (labels or shapes) from the chart. Adds one or more objects (labels or shapes) on the chart. Single objects are passed through with to the **id** attribute. Multiple objects are passed through as an array of objects to the **id** attribute.
| Value | Type | Details |
|---|---|---|
| Parameter | Object | Shape/Label Object |
| Return | jQuery | jQuery Object |
Removing a single object
;Removing multiple objects
;#### .repaintObjects( object ) #### Repaints the entire object collection that was called with **update** set to **false** in the options. It's useful for deferring object changes if you want all the changes to appear at once.
| Value | Type | Details |
|---|---|---|
| Parameter | Object (optional) | GraphID Object |
| Return | jQuery | jQuery Object |
;#### .updateObject( object ) #### Updates one or more objects (labels or shapes) of the chart. Single objects are passed through within the **data** object. Multiple objects are passed through as an array of objects within the **data** object.
| Value | Type | Details |
|---|---|---|
| Parameter | Object | Shape/Label Object |
| Return | jQuery | jQuery Object |
Updating a single object
;Updating multiple objects
;## Labels ## #### .addLabel( object ) #### Adds a single label to the chart. This is just a shortcut from addObject.
| Value | Type | Details |
|---|---|---|
| Parameter | Object | Label Object |
| Return | jQuery | jQuery Object |
;## Rules ##
Requires the zingchart-html5-api-rules-min.js module
.addRule( object )
Adds a rule to a chart, applying the effect to any node that meets the conditions. The rules make use of the various tokens that ZingChart has available. Visit here to see the full range of available tokens (be warned: there are lots).
| Value | Type | Details |
|---|---|---|
| Parameter | Object | Rule Object |
| Return | jQuery | jQuery Object |
; // Now, any nodes with a value below 50 will have a background color of #FF0. Pretty simple!#### .removeRule( object ) #### Removes either a single rule or a series of rules from a chart.
| Value | Type | Details |
|---|---|---|
| Parameter | Object | Rule Object |
| Return | jQuery | jQuery Object |
Removing a single rule.
; // Poof. Rule1 is gone.Removing multiple rules.
;#### .updateRule( object ) #### Update an existing rule, specified by the **id** and the **plotindex** if there are multiple plots.
| Value | Type | Details |
|---|---|---|
| Parameter | Object | Rule Object |
| Return | jQuery | jQuery Object |
; // rule1 on plotindex 0 now has a background gradient from red to blue## Selection ## #### .clearSelection( object ) #### Clears the current node(s) selection. See the [plot series item](http://www.zingchart.com/docs/json-attributes-syntax/graph-objects/plot-series-item/) for more informatino on working with selections.
| Value | Type | Details |
|---|---|---|
| Parameter | Object (optional) | GraphID Object |
| Return | jQuery | jQuery Object |
; // Any nodes specified by selection are now deselected.#### .deselect( object ) #### Deselects a combination of nodes in the chart specified by **plotindex** and **nodeindex**. Both the **nodeindex** and **plotindex** can be specified individually (0), as a range ("0-3"), or as a group ([0,2,6]).
| Value | Type | Details |
|---|---|---|
| Parameter | Object | Select Object |
| Return | jQuery | jQuery Object |
Deselecting from a single plot.
; // Nodes at index 1-3 in plot 0 have been deselected.Deselecting from multiple plots.
; // Nodes at index 0 and 2 in plot 0 and the node at index 1 in plot 1 have been deselected.#### .getSelection( object ) #### Returns the current node(s) selected.
| Value | Type | Details |
|---|---|---|
| Parameter | Object (optional) | GraphID Object |
| Return | jQuery | jQuery Object |
mySelection = ;#### .select( object ) #### Sets a combination of nodes in the chart if selected. If **toggle** is true, then the nodes already selected will be deselected. Both the **nodeindex** and **plotindex** can be specified individually aa number (0), as a range in a string ("0-3"), or as a group in an array ([0,2,6]).
| Value | Type | Details |
|---|---|---|
| Parameter | Object | Select Object |
| Return | jQuery | jQuery Object |
#### .setSelection( object ) #### Another method setting node selection of the chart. Selection is passed as an array of arrays where each array corresponds to a plotindex of the chart and each number in the array corresponds to a nodeindex in that plot.
| Value | Type | Details |
|---|---|---|
| Parameter | Object | Select Object |
| Return | jQuery | jQuery Object |
; // The nodes at index 1 and 2 of plot index 0 are now selected as are the nodes at 0 and 3 of plot index 1.## Toggle ## #### .disable( string) #### Disable makes the chart inactive for user interactions. This is useful in the case of time-consuming operations. An optional string can be passed through that will be displayed as a message on top of the disabled chart.
| Value | Type | Details |
|---|---|---|
| Parameter | String (optional) | Disable Message |
| Return | jQuery | jQuery Object |
; // Disclaimer: you don't have to use John Mayer lyrics in your disable message but no one would fault you if you did.#### .enable() #### Enables a chart for user interactions, turning off the disabled attribute.
| Value | Type | Details |
|---|---|---|
| Parameter | ||
| Return | jQuery | jQuery Object |
;#### .fullscreen() #### Randers the chart in fullscreen. Can be exited with .exitFullscreen() or hitting the escape key.
| Value | Type | Details |
|---|---|---|
| Parameter | ||
| Return | jQuery | jQuery Object |
;#### .exitFullscreen() #### Destroys the fullscreen render of the chart.
| Value | Type | Details |
|---|---|---|
| Parameter | ||
| Return | jQuery | jQuery Object |
;#### .maximizeLegend() #### Maximizes the legend.
| Value | Type | Details |
|---|---|---|
| Parameter | ||
| Return | jQuery | jQuery Object |
;#### .minimizeLegend() #### Minimizes the legend.
| Value | Type | Details |
|---|---|---|
| Parameter | ||
| Return | jQuery | jQuery Object |
;#### .showMenu() #### Shows the context menu.
| Value | Type | Details |
|---|---|---|
| Parameter | ||
| Return | jQuery | jQuery Object |
;#### .hideMenu() #### Hides the context menu.
| Value | Type | Details |
|---|---|---|
| Parameter | ||
| Return | jQuery | jQuery Object |
;#### .showPlot( object ) #### Shows the plot specified by **plotindex** or **plotid**.
| Value | Type | Details |
|---|---|---|
| Parameter | Object | Plot Index Object |
| Return | jQuery | jQuery Object |
;#### .showAllPlots( object ) #### Shows ALL plots. Takes an optional object as a parameter than can specify a **graphid**.
| Value | Type | Details |
|---|---|---|
| Parameter | Object | Graph ID Object |
| Return | jQuery | jQuery Object |
Show all plots for all graphs.
;Show all plots for a specific graph.
;#### .showAllPlotsBut( object ) #### > This won't have a visible effect unless some charts have been hidden.
Shows ALL plots EXCEPT the plotindex you specify. An optional graphid attribute can be passed as well to affect only that graph.
| Value | Type | Details |
|---|---|---|
| Parameter | Object | Specify the plotindex (required) and the graphid (optional) |
| Return | jQuery | jQuery Object |
Show all plots except plotindex 0 for all graphsets.
;Show all plots except plotindex 0 for graphid "graph0".
;#### .hidePlot( object ) #### Hides the plot specified by **plotindex** or **plotid**.
| Value | Type | Details |
|---|---|---|
| Parameter | Object | Plot Index Object |
| Return | jQuery | jQuery Object |
;#### .hideAllPlots( object ) #### Hides ALL plots. Takes an optional object as a parameter than can specify a **graphid**.
| Value | Type | Details |
|---|---|---|
| Parameter | Object | Graph ID Object |
| Return | jQuery | jQuery Object |
Hide all plots for all graphs.
;Hide all plots for a specific graph.
;#### .hideAllPlotsBut( object ) #### Hides ALL plots EXCEPT the plot index you specify via the attribute **plotindex**. An optional graphset can be set via the attribute **graphid**.
| Value | Type | Details |
|---|---|---|
| Parameter | Object | Specify the plotindex (required) and the graphid (optional) |
| Return | jQuery | jQuery Object |
Hide all plots across all graphsets except plotindex 0
;Hide all plots on the graphid "graph0" except plotindex 0
;#### .toggleAbout() #### Toggle the 'About' screen on and off.
| Value | Type | Details |
|---|---|---|
| Return | jQuery | jQuery Object |
;#### .toggleBugReport() #### Toggle the 'Bug Report' screen on an off.
| Value | Type | Details |
|---|---|---|
| Return | jQuery | jQuery Object |
;#### .toggleDimension() #### For graphs with the option of 3D mode, toggles between 2D and 3D.
| Value | Type | Details |
|---|---|---|
| Return | jQuery | jQuery Object |
;#### .toggleLegend() #### Toggle the visibility of the legend.
| Value | Type | Details |
|---|---|---|
| Return | jQuery | jQuery Object |
;#### .toggleLens() #### Toggle the visibility of the lens.
| Value | Type | Details |
|---|---|---|
| Return | jQuery | jQuery Object |
;#### .toggleSource() #### Toggle the visibility of the View Source Screen.
| Value | Type | Details |
|---|---|---|
| Return | jQuery | jQuery Object |
;## Zoom ## #### .viewAll() #### Resets the zoom of the chart to 'view all'. Big surprise, eh?
| Value | Type | Details |
|---|---|---|
| Return | jQuery | jQuery Object |
;#### .zoomIn( object ) #### Zooms in the graph. **zoomx** and **zoomy** allow you to determine which scales will zoom by setting them to ```true``` or ```false```.
| Value | Type | Details |
|---|---|---|
| Parameter | Object | Zoom Object |
| Return | jQuery | jQuery Object |
; // The chart will now zoom in only by scaling the x-scale.#### .zoomOut( object ) #### Zooms out the graph. **zoomx** and **zoomy** allow you to determine which scales will zoom out by setting them to ```true``` or ```false```.
| Value | Type | Details |
|---|---|---|
| Parameter | Object | Zoom Object |
| Return | jQuery | jQuery Object |
; // The chart will now zoom out only by scaling the y-scale.#### .zoomTo( object ) #### Zooms to a specific area in a graph specified by **xmin**, **xmax**, **ymin**, **ymax**.
| Value | Type | Details |
|---|---|---|
| Parameter | Object | Zoom To Object |
| Return | jQuery | jQuery Object |
; // The chart will now be zoomed in to show// values 10 through 30 on the x-scale and // values 12 through 17 on the y scale.#### .zoomToValues( object ) #### Zooms to a specific area in a graph specified by x-scale values or labels. Use this option when you're x-axis doesn't use numbers (i.e. months, names, etc).
| Value | Type | Details |
|---|---|---|
| Parameter | Object | Zoom To Values Object |
| Return | jQuery | jQuery Object |
; // The chart will now be zoomed in to show// values "Feb" through "Apr" on the x-scale // and values 200 through 300 on the y scale.# Events[](#events) #
Events are one of the most powerful aspects of the ZingChart API. While other charting libraries have only a handful of events, ZingChart provides dozens of built-in events to monitor and track.
All events take a callback as a argument. Within that callback, you have access to both the jQuery object (the DOM element in which the chart resides) and the event object, an object which reveals different data for each event.
To access the jQuery object, simply use this.
To access the event object, use this.event.
Here's an example using the node click event:
;Under The Hood
What we're doing here is extending the jQuery object with a custom 'event' attribute. That event attribute holds all the event data returned by the ZingChart event API call. What this allows us to do is retain access to the jQuery element and all it's associated attributes and functionality while also providing easy and granular access to the event attributes. The scope of the extended jQuery object only exists inside the event function and doesn't affect jQuery performance or functionality in anyway. That means less code and more win.
The Event Object
ev: MouseEvent graphid: "myChart-graph-id0" id: "myChart" key: 2 nodeindex: 2 plotid: "" plotindex: 0 scaletext: "2" text: "9" value: 9Let's get down to business with the events.
Animation Events
.animationStart( callback )
Fires the callback when the chart's animation starts.
Sample Event Object
// The id of the chart id: "myChart" // The id of the graph graphid: "myChart-graph-id0";#### .animationEnd( callback ) Fires the callback when the chart's animation ends.
Sample Event Object
// The id of the chart id: "myChart" // The id of the graph graphid: "myChart-graph-id0";#### .animationStep( callback ) Fires the callback for every step of the animation, for every plot/node. That means it fires A LOT. Like, dozens of times. Be **very** careful what you do inside the callback as it is very easy to kill your browser if you use this improperly.
Sample Event Object
// The id of the chart id: "myChart" // The id of the graph graphid: "myChart-graph-id0" // The index of the node being animated nodeindex: 0 // The index of the plot being animated plotindex: 0 // The "position" in the animation timeline. // It starts from 0 and ends as 1 but for several animation methods, intermediate values can exceed 1 stage: 1;## Data Manipulation Events #### .chartModify( callback ) Fires the callback when ZingChart is modified via the modify API call. This applies to both the wrapper method and the hand-coded modify method.
Sample Event Object
// The id of the chart id: "myChart" // The id of the graph graphid: "myChart-graph-id0" // The object being modified object: 'title' // The data passed through to modify the object. // In this case, it's text for a new title. text: 'A whole new title';#### .nodeAdd( callback ) Fires the callback when a node is added to the chart.
Sample Event Object
// The id of the chart id: "myChart" // The id of the graph graphid: "myChart-graph-id0" // The node's key key: 5 // The node's index. nodeindex: 5 // The plot's index to which the node was added. plotindex: 0 // The text of the node (similar to value) text: 11 // The value of the node value: 11;#### .nodeRemove( callback ) Fires the callback when a node is removed from the chart.
Sample Event Object
// The id of the chart id: "myChart" // The id of the graph graphid: "myChart-graph-id0" // The node's key key: 2 // The node's index. nodeindex: 2 // The plot's index from which the node was removed. plotindex: 1 // The text of the node (similar to value) text: 21 // The value of the node value: 21;#### .plotAdd( callback ) Fires the callback when a plot is added to the chart.
Sample Event Object
// The id of the chart id: "myChart" // The id of the graph graphid: "myChart-graph-id0" // The index of the added plot. plotindex: 1 // Data about the added plot (object) data: // This object contains information about the added plot. // Example data includes: an array of values, the palette, etc. ;#### .plotRemove( callback ) Fires the callback when a plot is removed from the chart.
Sample Event Object
// The id of the chart id: "myChart" // The id of the graph graphid: "myChart-graph-id0" // The node's key key: 2 // The index of the removed plot. plotindex: 1;#### .plotModify( callback ) Fires the callback when a plot of the chart is modified.
Sample Event Object
// The id of the chart id: "myChart" // The id of the graph graphid: "myChart-graph-id0" // The index of the added plot. plotindex: 0 // Data about the added plot (object) data: // This object contains information about the modified plot. // Whatever info is passed in the data object when modifyPlot // is called will appear here. // Example data includes: an array of values, the color, etc. ;#### .chartReload( callback ) Fires the callback when the chart is reloaded.
Sample Event Object
// The id of the chart id: "myChart" // The render type of the added chart. output: 'canvas' // The new height of the chart. height: 300 // The new width of the chart. width: 500 // The x position of the chart. x: 0 // The y position of the chart. y: 0 // Data about the reload call (object) params: ;#### .dataSet( callback ) Fires the callback when the chart is reloaded.
Sample Event Object
// The id of the chart id: "myChart" // The data packet that was sent (object) data: ;## Export Events #### .dataExport( callback ) Fires the callback when the user exports the graph data.
NOTE: Only works if exportdataurl is set in .zingchart options.
;#### .imageSave( callback ) Fires the callback when the user saves an image of the graph.
NOTE: Only works if exportimageurl is set in .zingchart options.
;#### .chartPrint( callback ) Fires the callback when the user prints the graph.
Sample Event Object
// The id of the chart id: "myChart" // The render type of the printed chart. output: 'canvas' // The height of the chart. height: 300 // The width of the chart. width: 500 // The x position of the chart. x: 0 // The y position of the chart. y: 0 // Data about the print call (object) params: ;## Feed Events #### .feedClear( callback ) Fires the callback when the feed is cleared.
| Value | Type | Details |
|---|---|---|
| Parameter | Callback | |
| Return | jQuery |
Sample Event Object
// The id of the chart id: "myChart" // The render type of the feed chart. output: 'canvas' // The height of the chart. height: 300 // The width of the chart. width: 500 // The x position of the chart. x: 0 // The y position of the chart. y: 0 // Data about the clearFeed call (object) params: ;#### .feedIntervalModify( callback ) Fires the callback when the feed's interval is modified.
;#### .feedStart( callback ) Fires the callback when the feed starts.
Sample Event Object
// The id of the chart id: "myChart" // The render type of the feed chart. output: 'canvas' // The height of the chart. height: 300 // The width of the chart. width: 500 // The x position of the chart. x: 0 // The y position of the chart. y: 0 // Data about the clearFeed call (object) params: ;#### .feedStop( callback ) Fires the callback when the feed stops.
Sample Event Object
// The id of the chart id: "myChart" // The render type of the feed chart. output: 'canvas' // The height of the chart. height: 300 // The width of the chart. width: 500 // The x position of the chart. x: 0 // The y position of the chart. y: 0 // Data about the stopFeed call (object) params: ;## Global Events #### .graphClick( callback ) Fires the callback when the user clicks anywhere in the graph. All attributes of the event object are dependent on where the click originated.
Sample Event Object
// The id of the chart id: "myChart" // The id of the graph graphid: "myChart-graph-id0" // If the click was inside, the plotarea, this will be true. // Otherwise, it will be false. plotarea: true // The target will be set to whatever element of the chart was clicked. // If no specific object was clicked, target will equal "none". target: "node" // The targetid will be the ID in the DOM of the object you clicked. targetid: "myChart-graph-id0-plotset0-plot0-plot-1-node-0" // The x position of the click event. x: 168203125 // The y position of the click event. y: 215625 // Touch tells if the event was triggered by a touch-screen. touch: false // Data about the stopFeed call (object) ev: // MouseEvent;#### .graphComplete( callback ) Fires the callback when the graphset is completely rendered. It's called even on API calls that require chart repaint.
| Value | Type | Details |
|---|---|---|
| Parameter | Callback | |
| Return | jQuery |
;#### .graphDataParse( callback ) Fires the callback when the data is availabe for the chart, prior to parsing routines. Useful for changing/adding elements into the data.
| Value | Type | Details |
|---|---|---|
| Parameter | Callback | |
| Return | jQuery |
;#### .graphDataReady( callback ) Fires the callback when the data is ready to be parsed.
| Value | Type | Details |
|---|---|---|
| Parameter | Callback | |
| Return | jQuery |
;#### .graphGuideMouseMove( callback ) Fires the callback when the guide position changes.
| Value | Type | Details |
|---|---|---|
| Parameter | Callback | |
| Return | jQuery |
;#### .graphLoad( callback ) Fires the callback only the first time the graphset is completely rendered.
| Value | Type | Details |
|---|---|---|
| Parameter | Callback | |
| Return | jQuery |
;#### .graphMenuItemClick( callback ) Fires the callback when a context menu item is clicked.
| Value | Type | Details |
|---|---|---|
| Parameter | Callback | |
| Return | jQuery |
;#### .graphResize( callback ) Fires the callback when the graph is resized.
| Value | Type | Details |
|---|---|---|
| Parameter | Callback | |
| Return | jQuery |
;## History Events #### .historyForward( callback ) Fires the callback when the users goes forward in the chart history.
| Value | Type | Details |
|---|---|---|
| Parameter | Callback | |
| Return | jQuery |
;#### .historyBack( callback ) Fires the callback when the user goes backward in the chart history.
| Value | Type | Details |
|---|---|---|
| Parameter | Callback | |
| Return | jQuery |
;## Interactive Events #### .nodeSelect( callback ) Fires the callback when Interactive Mode is on and a node is selected.
| Value | Type | Details |
|---|---|---|
| Parameter | Callback | |
| Return | jQuery |
;#### .nodeDeselect( callback ) Fires the callback when Interactive Mode is on and a node is deselected.
| Value | Type | Details |
|---|---|---|
| Parameter | Callback | |
| Return | jQuery |
;#### .plotSelect( callback ) Fires the callback when Interactive Mode is on and a plot is selected.
| Value | Type | Details |
|---|---|---|
| Parameter | Callback | |
| Return | jQuery |
;#### .plotDeselect( callback ) Fires the callback when Interactive Mode is on and a plot is deselected.
| Value | Type | Details |
|---|---|---|
| Parameter | Callback | |
| Return | jQuery |
;## Legend Events #### .legendItemClick( callback ) Fires the callback when a legend item is clicked.
| Value | Type | Details |
|---|---|---|
| Parameter | Callback | |
| Return | jQuery |
;#### .legendMarkerClick( callback ) Fires the callback when a legend marker is clicked.
| Value | Type | Details |
|---|---|---|
| Parameter | Callback | |
| Return | jQuery |
;#### .legendShow( callback ) Fires the callback when the legend is shown.
| Value | Type | Details |
|---|---|---|
| Parameter | Callback | |
| Return | jQuery |
;#### .legendHide( callback ) Fires the callback when the legend is hidden.
| Value | Type | Details |
|---|---|---|
| Parameter | Callback | |
| Return | jQuery |
;#### .legendMaximize( callback ) Fires the callback when the legend is maximized.
| Value | Type | Details |
|---|---|---|
| Parameter | Callback | |
| Return | jQuery |
;#### .legendMinimize( callback ) Fires the callback when the legend is minimized.
| Value | Type | Details |
|---|---|---|
| Parameter | Callback | |
| Return | jQuery |
;## Node Events #### .nodeClick( callback ) Fires the callback when a node is clicked.
| Value | Type | Details |
|---|---|---|
| Parameter | Callback | |
| Return | jQuery |
;#### .nodeDoubleClick( callback ) Fires the callback when a node is double clicked.
| Value | Type | Details |
|---|---|---|
| Parameter | Callback | |
| Return | jQuery |
;#### .nodeMouseOver( callback ) Fires the callback when the user's mouse enters a node.
| Value | Type | Details |
|---|---|---|
| Parameter | Callback | |
| Return | jQuery |
;#### .nodeMouseOut( callback ) Fires the callback when the user's mouse exits a node.
| Value | Type | Details |
|---|---|---|
| Parameter | Callback | |
| Return | jQuery |
;#### .nodeHover( callback, callback ) Fires the first callback when the user's mouse enters a node. Fires the second callback when the user's mouse exits a node.
| Value | Type | Details |
|---|---|---|
| Parameter | Callback | |
| Return | jQuery |
;## Label Events #### .labelClick( callback ) Fires the callback when the user clicks a label.
| Value | Type | Details |
|---|---|---|
| Parameter | Callback | |
| Return | jQuery |
;#### .labelMouseOver( callback ) Fires the callback when the user's mouse enters a label.
| Value | Type | Details |
|---|---|---|
| Parameter | Callback | |
| Return | jQuery |
;#### .labelMouseOut( callback ) Fires the callback when the user's mouse exits a label.
| Value | Type | Details |
|---|---|---|
| Parameter | Callback | |
| Return | jQuery |
;#### .labelHover( callback, callback ) Fires the first callback when the user's mouse enters a label. Fires the second callback when the user's mouse exits a label.
| Value | Type | Details |
|---|---|---|
| Parameter | Callback | |
| Return | jQuery |
;## Shape Events #### .shapeClick( callback ) Fires the callback when the user clicks a shape.
| Value | Type | Details |
|---|---|---|
| Parameter | Callback | |
| Return | jQuery |
;#### .shapeMouseOver( callback ) Fires the callback when the user's mouse enters a shape.
| Value | Type | Details |
|---|---|---|
| Parameter | Callback | |
| Return | jQuery |
;#### .shapeMouseOut( callback ) Fires the callback when the user's mouse exits a shape.
| Value | Type | Details |
|---|---|---|
| Parameter | Callback | |
| Return | jQuery |
;#### .shapeHover( callback, callback ) Fires the first callback when the user's mouse enters a shape. Fires the second callback when the user's mouse exits a shape.
| Value | Type | Details |
|---|---|---|
| Parameter | Callback | |
| Return | jQuery |
;## Plot Events #### .plotClick( callback ) Fires the callback when the user clicks a plot.
| Value | Type | Details |
|---|---|---|
| Parameter | Callback | |
| Return | jQuery |
;#### .plotDoubleClick( callback ) Fires the callback when the user double-clicks a plot.
| Value | Type | Details |
|---|---|---|
| Parameter | Callback | |
| Return | jQuery |
;#### .plotMouseOver( callback ) Fires the callback when the user's mouse enters a plot.
| Value | Type | Details |
|---|---|---|
| Parameter | Callback | |
| Return | jQuery |
;#### .plotMouseOut( callback ) Fires the callback when the user's mouse exits a plot.
| Value | Type | Details |
|---|---|---|
| Parameter | Callback | |
| Return | jQuery |
;#### .plotHover( callback, callback ) Fires the first callback when the user's mouse enters a plot. Fires the second callback when the user's mouse exits a plot.
| Value | Type | Details |
|---|---|---|
| Parameter | Callback | |
| Return | jQuery |
;#### .plotShow( callback ) Fires the callback when a plot is shown.
| Value | Type | Details |
|---|---|---|
| Parameter | Callback | |
| Return | jQuery |
;#### .plotHide( callback ) Fires the callback when a plot is hidden.
| Value | Type | Details |
|---|---|---|
| Parameter | Callback | |
| Return | jQuery |
;## Toggle Events #### .aboutShow( callback ) Fires the callback when the About Screen is opened.
| Value | Type | Details |
|---|---|---|
| Parameter | Callback | |
| Return | jQuery |
;#### .aboutHide( callback ) Fires the callback when the About Screen is closed.
| Value | Type | Details |
|---|---|---|
| Parameter | Callback | |
| Return | jQuery |
;#### .bugReportShow( callback ) Fires the callback when the Report Bug Screen is opened.
| Value | Type | Details |
|---|---|---|
| Parameter | Callback | |
| Return | jQuery |
;#### .bugReportHide( callback ) Fires the callback when the Bug Report Screen is closed.
| Value | Type | Details |
|---|---|---|
| Parameter | Callback | |
| Return | jQuery |
;#### .dimensionChange( callback ) Fires the callback when the dimension is toggled between 2D and 3D.
| Value | Type | Details |
|---|---|---|
| Parameter | Callback | |
| Return | jQuery |
;#### .lensShow( callback ) Fires the callback when the lens is shown.
| Value | Type | Details |
|---|---|---|
| Parameter | Callback | |
| Return | jQuery |
;#### .lensHide( callback ) Fires the callback when the lens is hidden.
| Value | Type | Details |
|---|---|---|
| Parameter | Callback | |
| Return | jQuery |
;#### .sourceShow( callback ) Fires the callback when the source is shown.
| Value | Type | Details |
|---|---|---|
| Parameter | Callback | |
| Return | jQuery |
;#### .sourceHide( callback ) Fires the callback when the source is hidden.
| Value | Type | Details |
|---|---|---|
| Parameter | Callback | |
| Return | jQuery |
;## Zoom Events #### .zoomEvent( callback ) Fires the callback when a zoom event occurs.
| Value | Type | Details |
|---|---|---|
| Parameter | Callback | |
| Return | jQuery |
;## Additional Methods
The following methods are amalgamations of other ZingChart methods. While not built in, they make use of the API and allow you to perform tedious tasks with minimal code and that's pretty sweet.
.setTitle( string OR object )
Allows the title to be set dynamically. This method accepts either a string or an object. The string parameter is useful if you just with to set the title's text and not style the title. The object parameter allows you to set both the text and the style for the title of the chart.
| Value | Type | Details |
|---|---|---|
| Parameter | String OR Object | String of new text OR Object with style and text. |
| Return | jQuery | jQuery Object |
Setting just text.
;Setting text and style.
;#### .setSubtitle( string OR object ) Allows the subtitle to be set dynamically. This method accepts either a string or an object. The string parameter is useful if you just with to set the subtitle's text and not style the subtitle. The object parameter allows you to set both the text and the style for the subtitle of the chart.
| Value | Type | Details |
|---|---|---|
| Parameter | String OR Object | String of new text OR Object with style and text. |
| Return | jQuery | jQuery Object |
Setting just text.
;Setting text and style.
;#### .setType( string ) Allows the type of the chart to be set dynamically. Want to make your bar chart a line chart? Done. How about a scatter chart? Wha-bam! Party time.
| Value | Type | Details |
|---|---|---|
| Parameter | String | Chart Type |
| Return | jQuery | jQuery Object |
;#### .drawTrendline( object ) Draws a trendline based off the data on the 0th plotindex. An optional object can be passed through to style the trendline.
| Value | Type | Details |
|---|---|---|
| Parameter | Object | Trendline Style |
| Return | jQuery | jQuery Object |
Using default style.
;Using custom style.
;