skd3
Sankey Diagram made easy. A javascript library that extends the popular D3.js/d3-sankey to enable fast and beautiful.


Inspired by the work of Mike Bostock's d3-sankey, As a proposal to simplify the generation of the sankey chart.
Sankey diagrams visualize the directed flow between nodes in an acyclic network. For example: (D3's classic energy sankey diagram) this diagram shows a possible scenario of UK energy production and consumption in 2050:
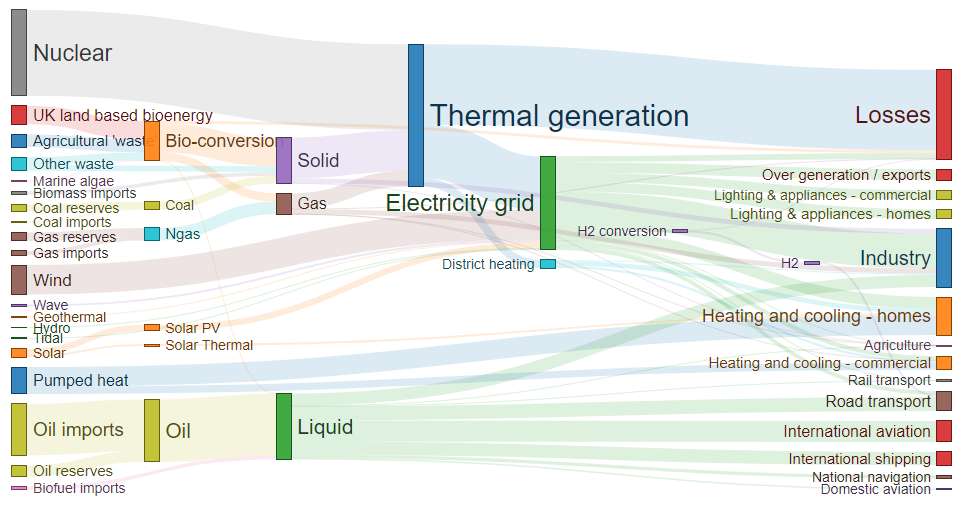
Source: Department of Energy & Climate Change, from: Mike Bostock - json sample.
See live sample
Dependencies
SKD3 requires D3v4 (d3.js) https://d3js.org/d3.v4.js.
Already tested with the latest version 4.10.2
Installing
If you use NPM, npm install skd3. Otherwise, download the latest release. You can also load directly from unpkg.com:
Usage
Simple sankey component, using less code and using recent components. Create your sankey diagram easily.
var objSankey = sk;Example of config:
var configSankey = margin: top: 10 left: 10 right: 10 bottom: 10 nodes: dynamicSizeFontNode: enabled: true minSize: 14 maxSize: 30 fontSize: 14 // if dynamicSizeFontNode not enabled draggableX: false // default [ false ] draggableY: true // default [ true ] colors: d3 links: { return d3val + ' TWh'; } unit: 'TWh' // if not set formatValue function tooltip: infoDiv: true // if false display default tooltip labelSource: 'Input:' labelTarget: 'Output:' Example data json:
var datajson = nodes: id: 0 name: "Alice" color: "green" id: 1 name: "Bob" color: "yellow" id: 2 name: "Carol" color: "blue"links: source: 0 target: 1 value: 1 source: 1 target: 2 value: 1;Update links values using d3`s transitions:
objSankey;Result:
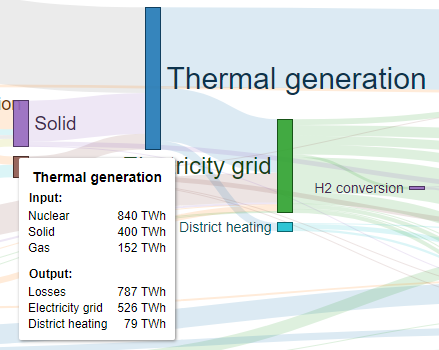
Support to tooltips (using option/tooltip/infoDiv)
Fetures:
- Dynamic node font size. More readable and better indicates values.
- Tooltip indicating the input and output values. Intuitive comparison.
- Update of values of the links with transition effect.
- Drag nodes horizontally and vertically.
Contributing
Pull requests and stars are always welcome. For bugs and feature requests, please create an issue
Author
Fabricio Rodrigues
License
Copyright © 2017 Fabricio Rodrigues Released under the MIT license.