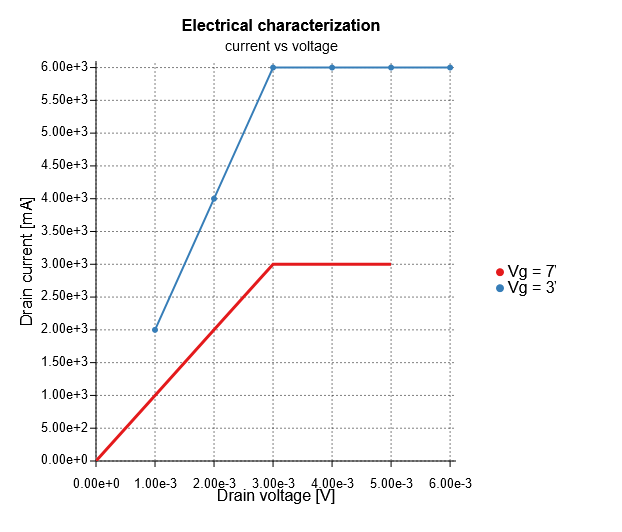
Library of React components to render SVG 2D plots.
Check our exhaustive documentation here.
Maintained by Zakodium
const Example = () => (
  <Plot
    width={550}
    height={500}
    margin={{ bottom: 50, left: 90, top: 50, right: 100 }}
  >
    <Heading
      title="Electrical characterization"
      subtitle="current vs voltage"
    />
    <LineSeries
      data={[
        { x: 0, y: 0 },
        { x: 1, y: 1 },
        { x: 2, y: 2 },
        { x: 3, y: 3 },
        { x: 4, y: 3 },
        { x: 5, y: 3 },
      ]}
      xAxis="x"
      yAxis="y"
      lineStyle={{ strokeWidth: 3 }}
      label="Vg = 7V"
      displayMarker={false}
    />
    <LineSeries
      data={[
        { x: 0, y: 0 },
        { x: 1, y: 1 },
        { x: 2, y: 2 },
        { x: 3, y: 3 },
        { x: 4, y: 3 },
        { x: 5, y: 3 },
      ]}
      xAxis="x"
      yAxis="y"
      displayMarker={true}
      markerShape="circle"
      label="Vg = 3V"
    />
    <Axis
      id="x"
      position="bottom"
      label="Drain voltage [V]"
      displayPrimaryGridLines
      max={6.1 / factor}
    />
    <Axis
      id="y"
      position="left"
      label="Drain current [mA]"
      displayPrimaryGridLines
      max={6.1 * factor}
    />
    <Legend position="right" />
  </Plot>
);
This code will result in this example
$ npm install --save react-plot
For major React hooks debugging use @simbathesailor/use-what-changed
import { useWhatChanged } from '@simbathesailor/use-what-changed';

function Example() {

  // useEffect, useCallback or useMemo
  useWhatChanged([a, b, c, d]); // debugs the below useEffect

  // displays names of variables instead of index
  // useWhatChanged([a, b, c, d], 'a, b, c, d', 'anysuffix-string');
  React.useEffect(() => {
    // console.log("some thing changed , need to figure out")
  }, [a, b, c, d]);

