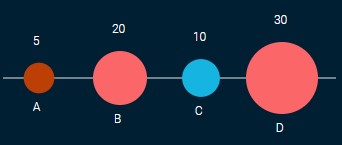
A linear bubble chart for reactjs

npm install --save react-linear-bubble-charts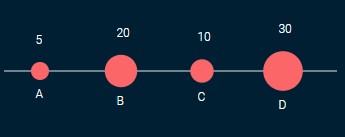
import React, { Component } from 'react'

import LinearBubbleChart from 'react-linear-bubble-charts'

class Example extends Component {
  render () {
    let data = [
        {
          title: "A",
          value: 5,
          color: "#bc3f05"
        },
        {
          title: "B",
          value: 20
        },
        {
          title: "C",
          value: 10,
          color: "#16b4e0"
        },
        {
          title: "D",
          value: 30
        }
      ]
    return (
      <LinearBubbleChart data={data} />
    )
  }
}| Prop | Type | Default | Comment |
|---|---|---|---|
| data | array | - | data for the component should be an array of objects with keys as title, value, color |
| bubbleSpacing | number | 90 | spacing between each bubble |
| maxBubbleSize | number | 35 | size of the bubble with max value |
| minBubbleSize | number | 12 | size of the bubble with minimum value |
| height | number | 300 | height of the svg element |
| bubbleColor | string | #FB6669 | color for the bubble if individual color is not given |
| titleColor | string | #000000 | color for the title of bubble |
| valueColor | string | #000000 | color for the value of bubble |
| lineColor | string | #ffffff | color for the base line |
| lineWidth | number | 1 | width for the base line |
| wordWrap | bool | false | Will put the word after space in a new line |
| onBubbleClick | function | null | click event for a bubble will return index , title, value |
##Author
Avin Vij