react-graph-n-plot
A graph component for inserting into react projects. Useful for small to medium size graphs.

![]()
Install
npm install --save react-graph-n-plot import Graph from 'react-graph-n-plot'Usage
Import the graph component and use it with props.
Each object inside the plotSets object will create a separate line. To graph only a single set of points, have only a single object inside plotSets.
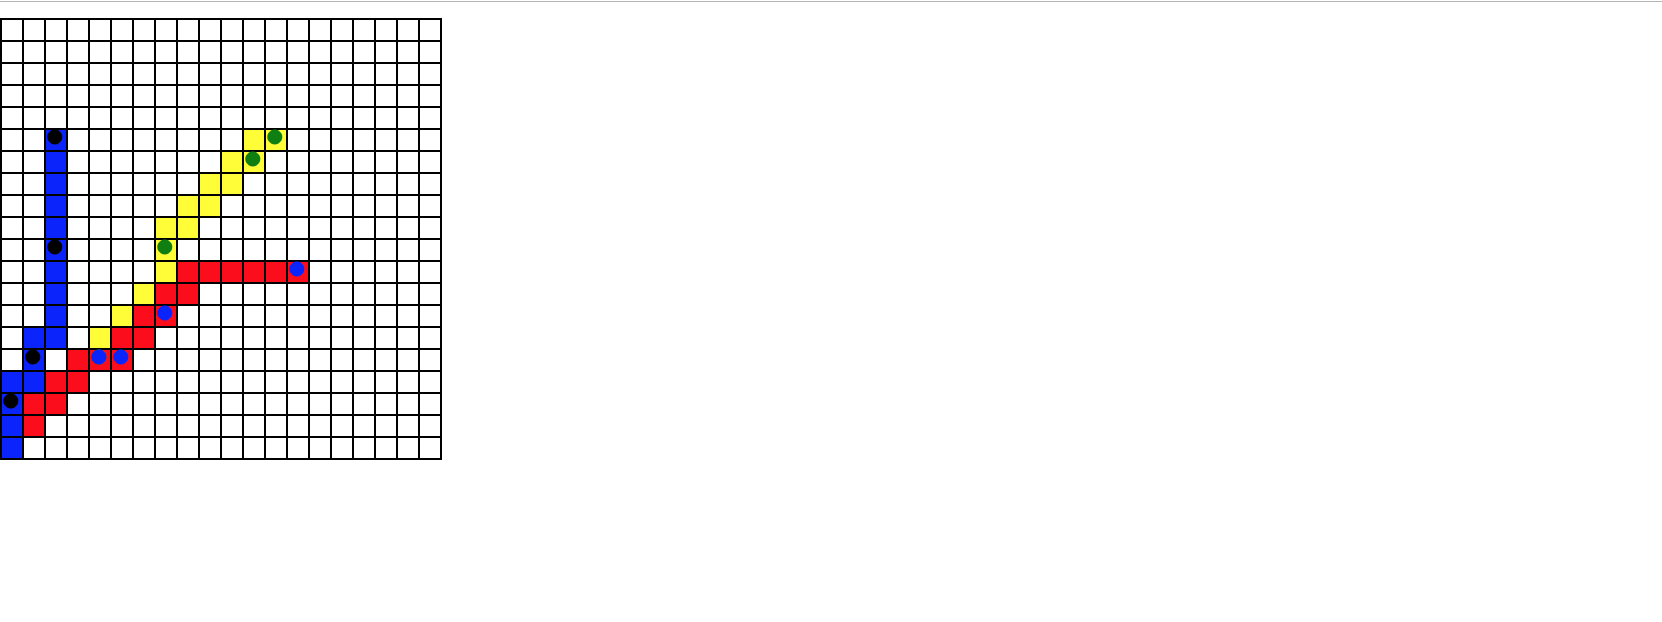
const plotSets = plots: x: 5 y: 5 x: 8 y: 10 x: 12 y: 14 x: 13 y: 15 plotColor: 'green' lineColor: 'yellow' plots: x: 5 y: 5 x: 6 y: 5 x: 8 y: 7 x: 14 y: 9 plotColor: 'blue' lineColor: 'red' plots: x: 1 y: 3 x: 2 y: 5 x: 3 y: 10 x: 3 y: 15 plotColor: 'black' lineColor: 'blue' { return <Graph = = /> }Props
The Graph takes two props.
-
setGraphSize - Object: sets the size of the graph. Both x and y must be equal.
-
plotSets - Object: contains one or many objects with the data used for plotting the points and connecting them to each other.
- plots - Array: an array of objects. Each object is the x/y coords of a plot point.
- plotColor - String: a string designating the color of the plot points. Leave blank for no visible plot points.
- lineColor - String: a string designating the color of the line being graphed. Leave blank for no line color.
License
MIT © chrisdel101