minum-dashboard
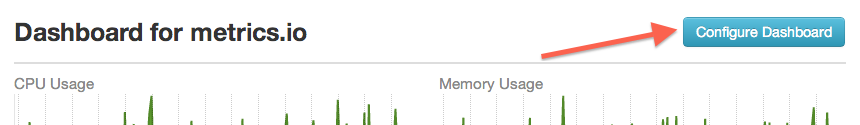
Dashboard for visualize and correlate metrics tracked via minum
Design Decisions
- Cloud Ready - Easily deployable into cloud
- Portable - Run as a standalone app locally
- Embeddable - Easily embed into existing
nodejswebapp
Dependencies
- Mongodb (2.1+)
- NodeJs
Accessing Dashboard
There are few ways you can access the dashboard.
1. Standalone App
Install minum-dashboard binary via npm
npm install minum-dashboard -g
Start Dashboard
minum-dashboard -m <mongodb url>
2. Deploy into Cloud
You can deploy dashboard into popular cloud providers in few minutes. First download or clone this repository into your local machine.
Heroku
- You can deploy dashboard into heroku as you do with other apps
- But first edit
conf/config.jsonforbasic-authsettings andmongo-url - If you are thinking to use mongodb addon on heroku, add it first and get the
mongo-urland configure it withconf/config.json
3. Deploy as a nodejs app manually
-
This repository is a deployable nodejs app and can be deployed as a typical
nodejsapp. -
By default dashboard runs with
basic-authand can be configured at/conf/config.json -
But it is recommend to run dashboard behind
nginxwithsslandbasic_auth. -
You can configure
portandmongo-urlin/conf/config.json -
After that run
start-dashboard.jswith nodejsnode start-dashboard.js
4. Embed with an existing express webapp
var express = ;var dashboard = ;var webapp = ; var MONGO_URL = "mongodb://localhost/test";dashboard; webapp;Using Dashboard
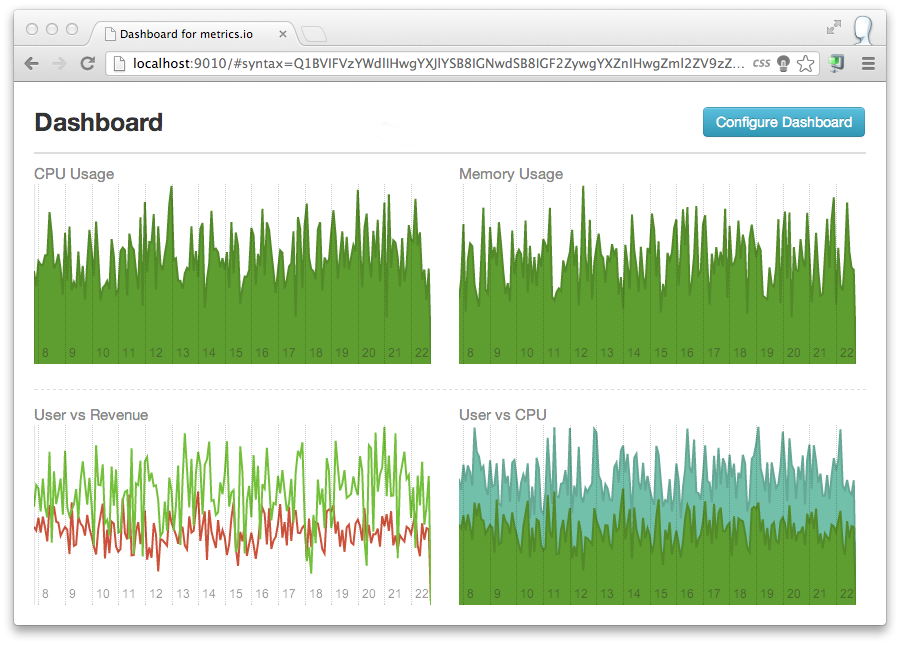
Inside the Dashboard you can create as many graphs as you need. You can correlate metrics too. (use area chart type)
There is no UI for defining graphs. But we have simple and flexible syntax to define them.
We simply did no use JSON since, it is too heavy for taking user inputs
Syntax
Here is how you define a graph.
<title for graph> | <graph-type> | <metric-name> | <value-aggregator>, <source-aggregator> | <resolution> | <time-length> | <list of sources - optional >
eg:- CPU Usage | area | cpu | avg, sum | five_secs | 1000 * 60 * 15 | source1, source2
- Supported values for
graph-type:area,line - Supported values for
value-aggregator: sum, avg, min, max - Supported values for
source-aggregator: sum, avg, min, max - Supported values for
resolution: five_secs, minute, hour, day - You can use multiple lines to specify multiple graphs
- Empty lines add empty block to dashboard instead of the graph
Permalink URLs
- Configuration you do will be saved in the URL.
- So you can simply copy URL and share with others.
- You can http://bit.ly or http://goo.gl to shorten the URL