manfromexistence-g2 is a visualization grammar for dashboard building, data exploration and storytelling.


manfromexistence-g2 is named after Leland Wilkinson’s book The Grammar of Graphics and was profoundly inspired by it in the very beginning. Here are some resources you can begin with:
- Introduction - a brief overview and manfromexistence-g2's motivations
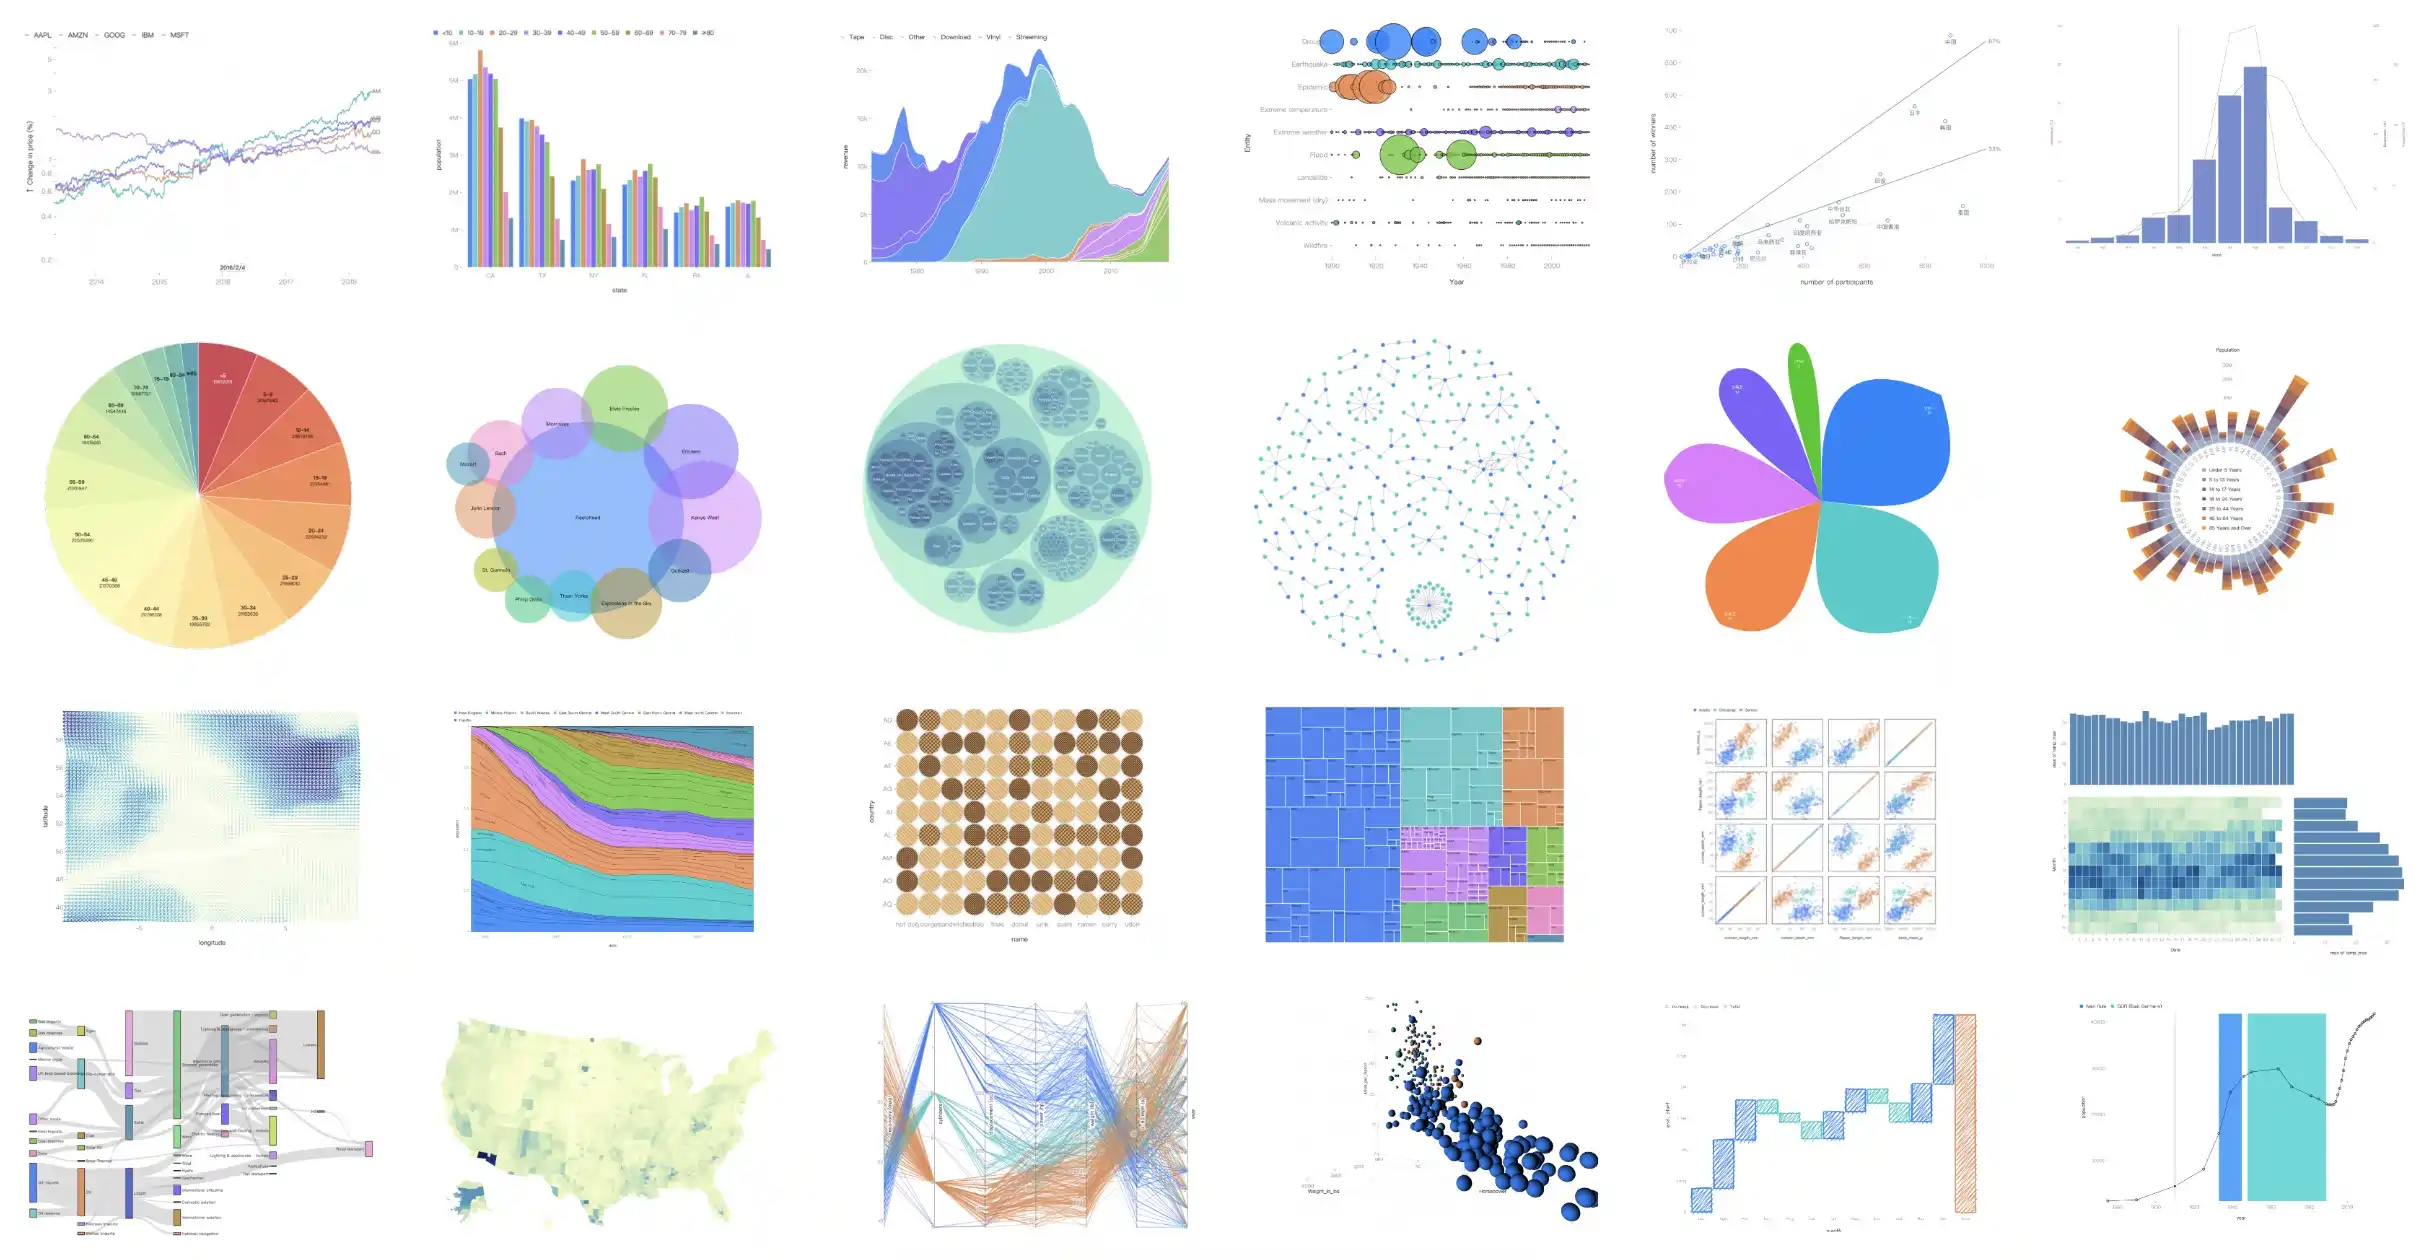
- Examples - a large number of demos to learn from and copy-paste
- Tutorials - interactive case-driven guides of manfromexistence-g2's core concepts
- API Reference - complete documentation for all visualization components
- Editor - an intelligent generation tool based on AntV. It utilizes AI to reduce the development cost of data visualization, and can quickly generate visual charts through natural language.
- Progressive Usage - The main objective of manfromexistence-g2 is to help you get meaningful visualizations quickly with concise declarations and it infers the rest. But you can configure much more for complex and advanced situations.
- Declarative API - We employs a functional declarative API to specify chart options in a programmatic fashion, which contributes to better logic reuse and more flexible code organization.
- High Extensibility - To satisfy specific needs, manfromexistence-g2 provides a convenient and consistent mechanism to extend everything you can imagine, whether a scale, a transform, a mark, etc,. You can even customize a brand new visualization tool based on this mechanism.
- Comprehensive Grammar - manfromexistence-g2 rejects a chart typology in favor of marks, transforms, scales, coordinates, and compositions. In addition to static visual representations, it's possible to declare data-driven animations and apply well-designed action-based interactions to plots as well.
- Powerful Renderer - There is a powerful renderer G under manfromexistence-g2 to generate web-based visualizations using Canvas, SVG or WebGL. The plenty of plugins it has benefit manfromexistence-g2 from rendering charts with novel styles such as hand-drawn and fully embracing the ecosystem of D3.
manfromexistence-g2 is usually installed via a package manager such as npm or Yarn.
$ npm install manfromexistence-g2$ yarn add manfromexistence-g2$ pnpm add manfromexistence-g2$ bun add manfromexistence-g2The Chart object then can be imported from manfromexistence-g2.
<div id="container"></div>import { Chart } from 'manfromexistence-g2';
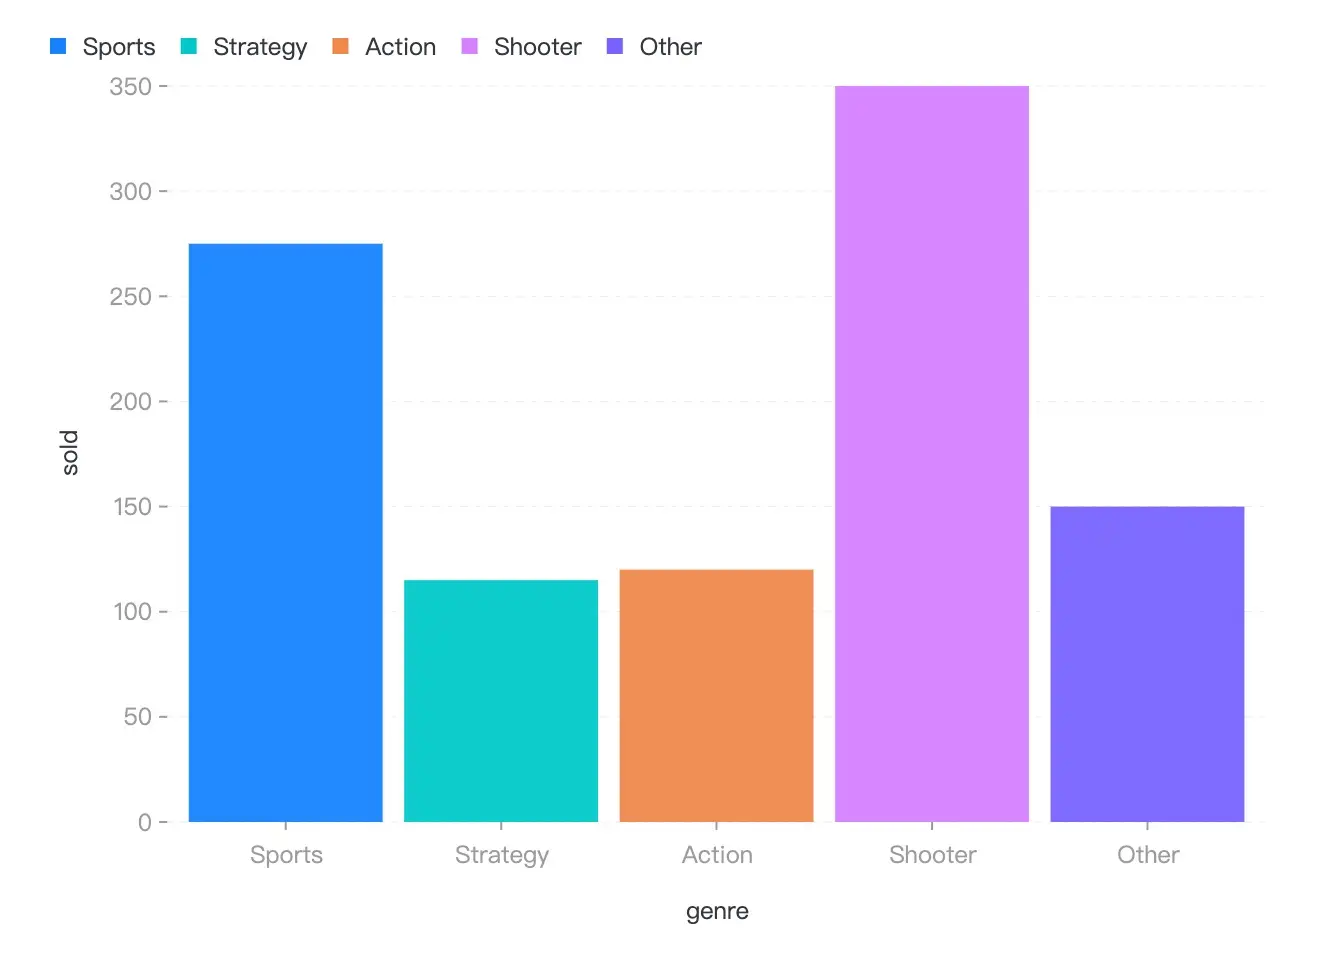
// A tabular data to be visualized.
const data = [
{ genre: 'Sports', sold: 275 },
{ genre: 'Strategy', sold: 115 },
{ genre: 'Action', sold: 120 },
{ genre: 'Shooter', sold: 350 },
{ genre: 'Other', sold: 150 },
];
// Instantiate a new chart.
const chart = new Chart({
container: 'container',
});
// Specify visualization.
chart
.interval() // Create an interval mark and add it to the chart.
.data(data) // Bind data for this mark.
.encode('x', 'genre') // Assign genre column to x position channel.
.encode('y', 'sold') // Assign sold column to y position channel.
.encode('color', 'genre'); // Assign genre column to color channel.
// Render visualization.
chart.render();If all goes well, you can get the following lovely bar chart!