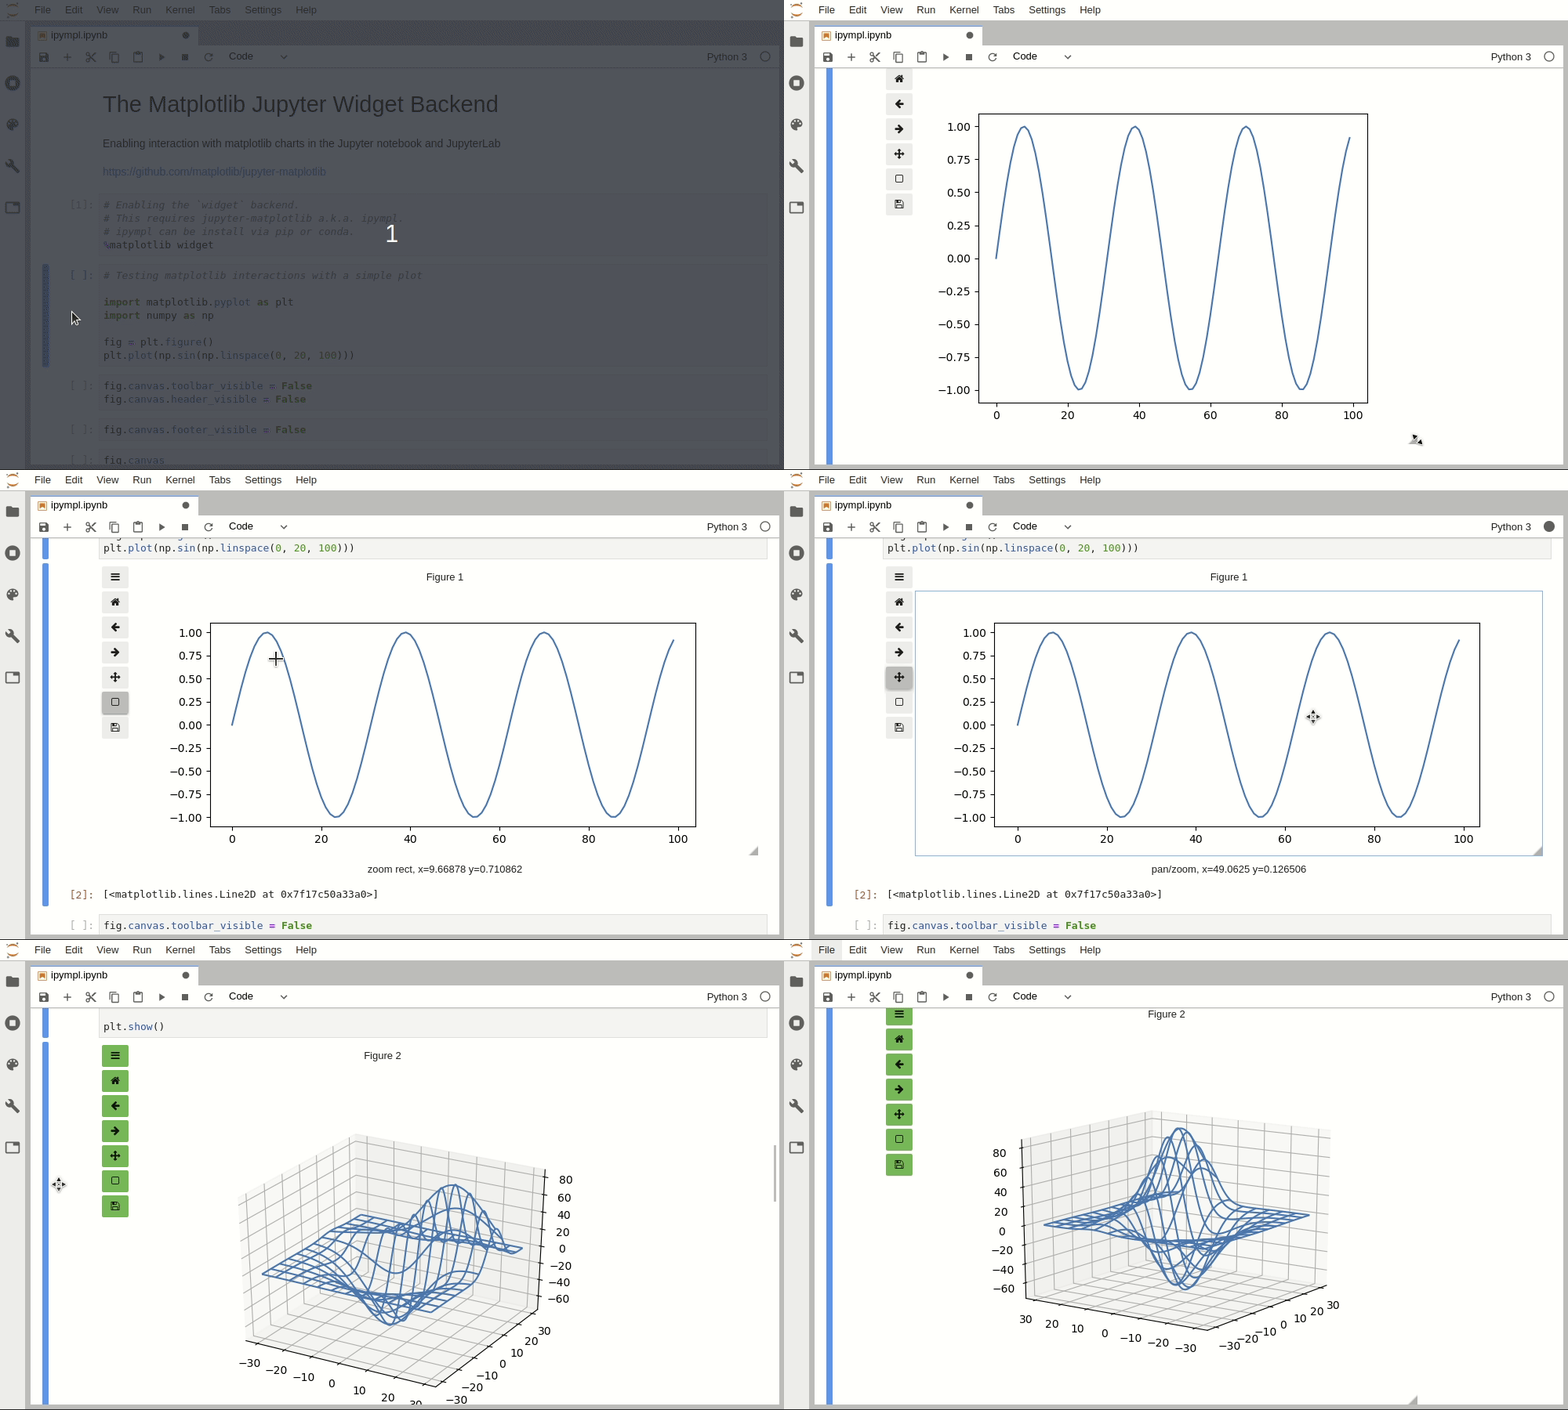
Leveraging the Jupyter interactive widgets framework, ipympl enables the interactive features of matplotlib in the Jupyter notebook and in JupyterLab.
Besides, the figure canvas element is a proper Jupyter interactive widget which can be positioned in interactive widget layouts.
To enable the ipympl backend, simply use the matplotlib Jupyter
magic:
%matplotlib widget
See the documentation at: https://matplotlib.org/ipympl/
See the example notebook for more!
conda install -c conda-forge ipymplpip install ipymplIf you want to use ipympl in JupyterLab, we recommend using JupyterLab >= 3.
If you use JupyterLab 2, you still need to install the labextension manually:
conda install -c conda-forge nodejs
jupyter labextension install @jupyter-widgets/jupyterlab-manager jupyter-matplotlibIf you are using JupyterLab 1 or 2, you will need to install the right jupyter-matplotlib version, according to the ipympl and jupyterlab versions you installed.
For example, if you installed ipympl 0.5.1, you need to install jupyter-matplotlib 0.7.0, and this version is only compatible with JupyterLab 1.
conda install -c conda-forge ipympl==0.5.1
jupyter labextension install @jupyter-widgets/jupyterlab-manager jupyter-matplotlib@0.7.0
Versions lookup table:
ipympl |
jupyter-matplotlib |
JupyterLab |
Matplotlib |
|---|---|---|---|
| 0.9.5-7 | 0.11.5-7 | >=2,<5 | >=3.5.0 |
| 0.9.3-4 | 0.11.3-4 | >=2,<5 | 3.4.0>= |
| 0.9.0-2 | 0.11.0-2 | >=2,<5 | 3.4.0>= <3.7 |
| 0.8.8 | 0.10.x | >=2,<5 | 3.3.1>= <3.7 |
| 0.8.0-7 | 0.10.x | >=2,<5 | 3.3.1>=, <3.6 |
| 0.7.0 | 0.9.0 | >=2,<5 | 3.3.1>= |
| 0.6.x | 0.8.x | >=2,<5 | 3.3.1>=, <3.4 |
| 0.5.8 | 0.7.4 | >=1,<3 | 3.3.1>=, <3.4 |
| 0.5.7 | 0.7.3 | >=1,<3 | 3.2.* |
| ... | ... | ... | |
| 0.5.3 | 0.7.2 | >=1,<3 | |
| 0.5.2 | 0.7.1 | >=1,<2 | |
| 0.5.1 | 0.7.0 | >=1,<2 | |
| 0.5.0 | 0.6.0 | >=1,<2 | |
| 0.4.0 | 0.5.0 | >=1,<2 | |
| 0.3.3 | 0.4.2 | >=1,<2 | |
| 0.3.2 | 0.4.1 | >=1,<2 | |
| 0.3.1 | 0.4.0 | >=0<2 |
Create a dev environment that has nodejs installed. The instructions here use mamba but you can also use conda.
mamba env create --file dev-environment.yml
conda activate ipympl-dev
Install the Python Packge
pip install -e .When developing your extensions, you need to manually enable your extensions with the notebook / lab frontend. For lab, this is done by the command:
jupyter labextension develop --overwrite .
jlpm build
For classic notebook, you need to run:
jupyter nbextension install --py --symlink --sys-prefix --overwrite ipympl
jupyter nbextension enable --py --sys-prefix ipymplTypescript:
If you use JupyterLab to develop then you can watch the source directory and run JupyterLab at the same time in different terminals to watch for changes in the extension's source and automatically rebuild the widget.
# Watch the source directory in one terminal, automatically rebuilding when needed
jlpm watch
# Run JupyterLab in another terminal
jupyter lab
After a change wait for the build to finish and then refresh your browser and the changes should take effect.
Python:
If you make a change to the python code then you will need to restart the notebook kernel to have it take effect.


