Infovyz
Infovyz is a visualization component library based on d3.js. It's aim is to provide charts with a simple API optimized for usage in self-updating real-time dashboards. Currently it offers bar charts, line charts and a geographic map.


Installation and Usage
npm
npm install infovyzbower_components
bower install infovyzClient Side Usage
Add the required files to your HTML file. Please note that Infovyz requires d3.js V4 (https://www.npmjs.com/package/d3) and d3-tile (https://www.npmjs.com/package/d3-tile).
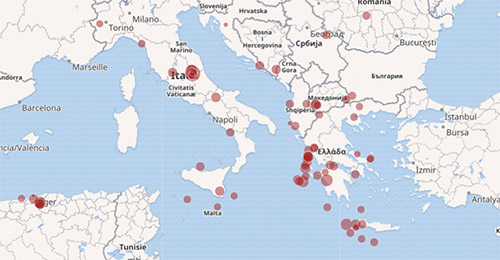
To get started and initialize a geographic map attached to the body tag, use the following JavaScript code:
var map = ;Just call map() again with an array of location objects to add some bubbles to the map:
;Examples
To run the examples in your browser, clone the repository to your local machine and run the other commands:
git clone https://github.com/weblyzard/infovyz.gitcd infovyznpm installnpm startThe console output should tell you at which address you can reach the static webserver, for example http://localhost:8080/examples.
- State Capitals: Basic usage, shows initialization and data updates. http://localhost:8080/examples/state-capitals/
- Earthquakes: Demonstrates automatic periodic data updates. http://localhost:8080/examples/earthquakes/
- Travel: Uses
map.panTo()to transition to certain locations. http://localhost:8080/examples/travel/
API Documentation
In addition to the examples, the library itself is documented in API.md.
Testing
Infovyz is using tape for testing its functionality:
npm installnpm testDevelopment
The build process uses rollup (https://github.com/rollup/rollup), so you can use ES6 modules, however the rest of the code is still ES5.
During development, using the following command allows you to watch the source files and do an automatic rebuild. Please note that minifying is not done at this stage.
npm run-script watch