LineChart
LineChart generator in node.js.
Install
npm install d3node-linechartUsage
const d3nLine = ;const line = Check out the examples for usage.
Output the visualization result to a image
npm run build
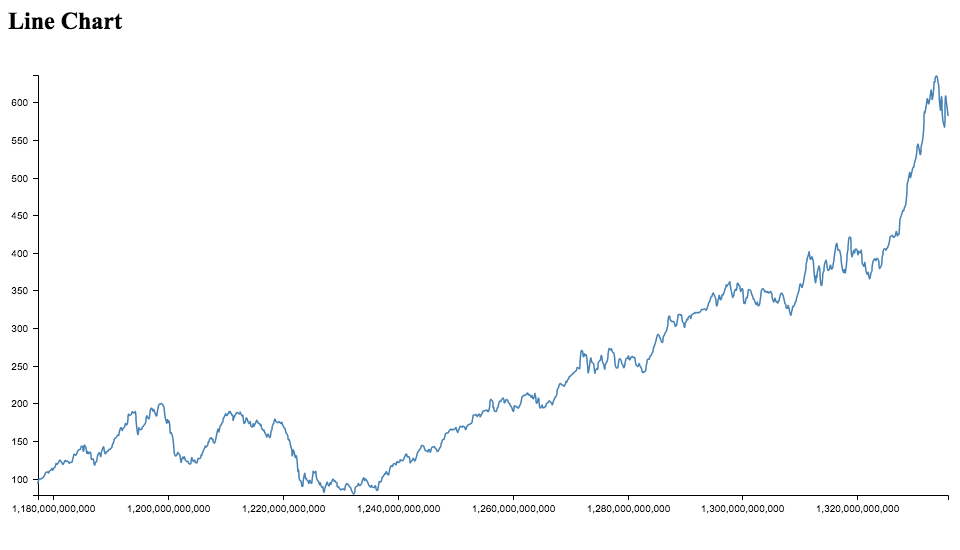
Output Preview (png):
API
d3nLine({ data[, selector, container, style] })
options
data
- Type:
Array
Data from file or web processed by d3 library.
Single line is of the form [ { key: x, value: y }, ...]
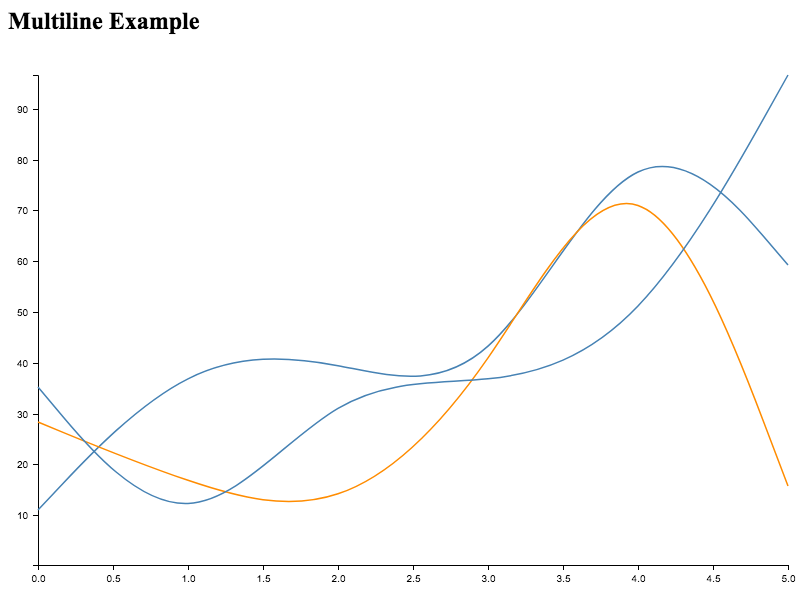
Multiline is of the form [ "keys": [all, possible, x's, ...], [ { key: x, value: y }, ...], ...].
Examples:
- Single line:
key: 0 value: 3 key: 1 value: 2 key: 2 value: 1 - Multiline:
"keys": 0 1 2 key: 0 value: 3 key: 1 value: 2 key: 2 value: 1 key: 0 value: 1 key: 1 value: 2 key: 2 value: 3 selector
- Type:
String - Default:
'#chart'
DOM selector in container.
container
- Type:
String - Default:
<div id="container"><h2>Line Chart</h2><div id="chart"></div></div>
DOM contain the visualization result.
style
- Type:
String - Default:
''
Linechart style.
Contributing
- Fork it!
- Create your feature branch:
git checkout -b my-new-feature - Commit your changes:
git commit -am 'Add some feature' - Push to the branch:
git push origin my-new-feature - Submit a pull request :D