browser-metrics
A collection of metrics tools for measuring performance.


Installation
npm install --save-dev browser-metricsThe problem solved
This module helps getting insight about how your app performs in production.
browsingMetrics
What does it do?
This function is intended to measure the following metrics:
- Time to first byte (
timeToFirstByte). It represents how long users have waited to get the first byte from the server - Time to first paint (
timeToFirstPaint). It represents how long users have waited to get the first paint on their screen. - Time to interactive (
timeToInteractive). This is the time elapsed between the beginning of the navigation and the call to the tool. When used in thecomponentDidMounthook of React, it can be used to get the time needed to get an interactive interface.
All the durations are in milliseconds and relative to the beginning of the navigation.
It takes advantage of the performance.timing model.
Example
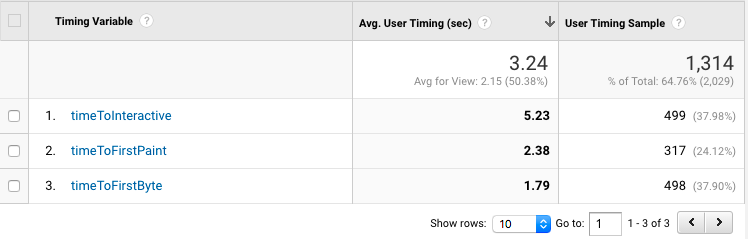
Notices that research only show meaningful effect, at the product level, for the time to interaction metric. Until research shows otherwise, you should consider the other metrics as simple technical indicators. source
Usage
;; Component { ; } { return <div>'This is the root node of my app.'</div> } ;API
browsingMetrics(object)
Arguments
options(object)
trackTiming(Function): This callback property is called for each collected metrics with three argumentscategory(string): Isload.name(string): name of the metric being collected.duration(number): duration measured for this metric.
[sampleRate=100](number): It can be used to sample the data send to a third party. It's expressed in percentage. The data aren't sampled. E.g. when used with the timing API of Google Analytics, you might want to send a portion of the data.[log=false](boolean): When turned totruethe collected data are displayed in the console.
Browser support
| Metric | IE | Edge | Firefox | Chrome | Safari |
|---|---|---|---|---|---|
timeToFirstByte |
>= 10 | ✓ | >= 38 | >= 25 | x |
timeToFirstPaint |
>= 10 | ✓ | x | >= 12 | x |
timeToInteractive |
>= 10 | ✓ | >= 38 | >= 25 | x |
Metric
What does it do?
This class is intended to help to measure the time spent in transactions. It's a simple helper around the User Timing API and the high resolution Performance.now() method.
For browsers that support the mark API, the transaction also appears in the DevTools. E.g. with Chrome:
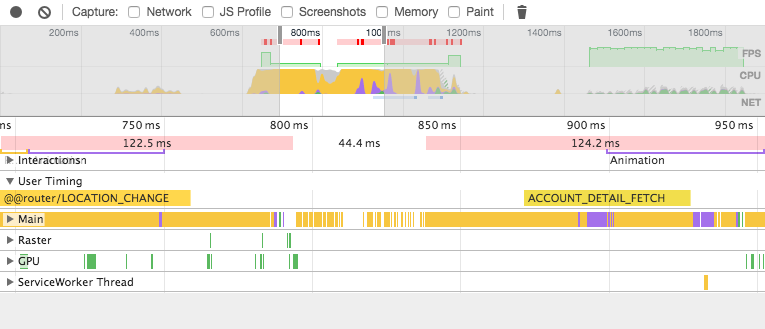
Usage
; const metric = 'ACCOUNT_DETAIL_FETCH';metricstart; // Do the CPU consuming work. metric;console; // 14.4 msAPI
Metric(Class)
duration(number)
Returns the duration of the timing metric or -1 if there a measurement has not been made.
start(Function)
Call to begin a measurement.
end(Function)
Call to end a measurement.
Browser support
| Feature | IE | Edge | Firefox | Chrome | Safari |
|---|---|---|---|---|---|
performance.now |
>= 10 | ✓ | >= 15 | >= 20 | >= 8 |
performance.mark |
>= 10 | ✓ | >= 41 | >= 43 | x |
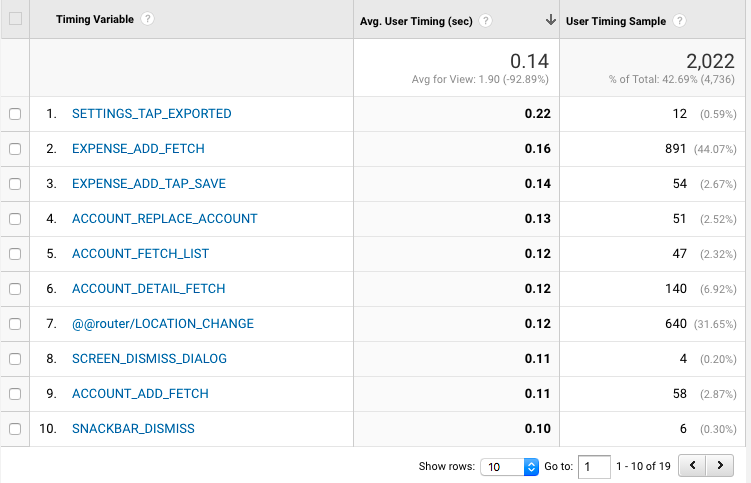
reduxMetricsMiddelware
What does it do?
This is a redux middleware. Redux has a nice design property, actions are performed synchronously in a transaction. That allow us to measure the time spent in each action.
When used with react-redux and the current react-dom reconciliation algorithm the time also take into account the render calls down the virtual DOM tree.
Example
Usage
;;const rootReducer = store; const store = ;API
metricsMiddleware(object)
Arguments
options(object)
trackTiming(Function): This callback property is called for each collected metrics with three argumentscategory(string): Isredux.name(string): name of the metric being collected.duration(number): duration measured for this metric.
[minDuration=50](number): It can be used to ignore non significant actions. An action must have a duration higher tominDurationto be reported.
Google Analytics
Metrics can be reported to Google Analytics using the User Timing section. E.g. with the analytics.js library.
// https://developers.google.com/analytics/devguides/collection/analyticsjs/user-timingswindow;Then, you can see the values in the UI.
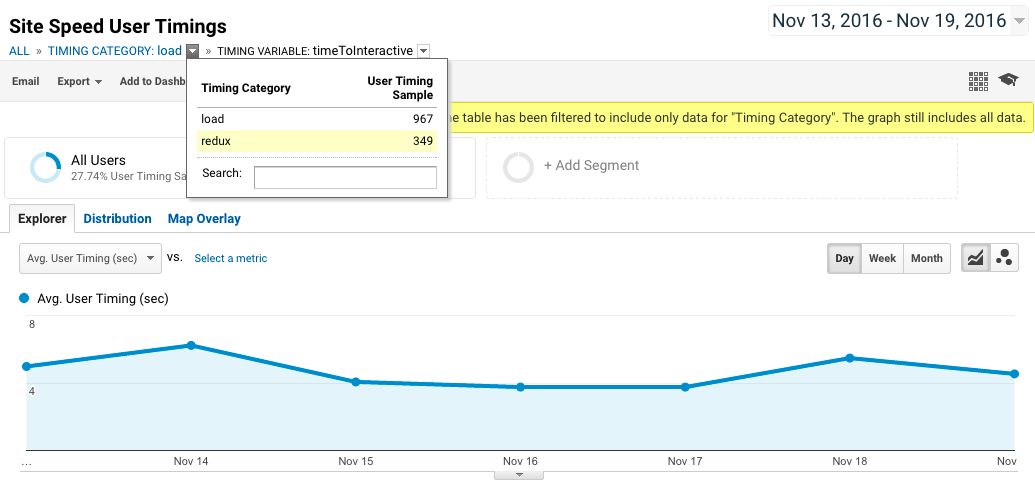
Notices the you shouldn't be using the mean as a performance indicator. Using the mediam (50th percentile) would be a much better indicator.
Ressources
- Progressive Web Apps with React.js: Part 2 — Page Load Performance
- The Difference Between Quantification, Measure, Metric, and KPI
Credit
- https://github.com/ebidel/appmetrics.js
- https://github.com/addyosmani/timing.js/blob/master/timing.js
- https://gist.github.com/acdha/a1fd7e91f8cd5c1f6916
- https://github.com/okor/justice/blob/master/src/js/justice.collectors.js
License
MIT