
Records all operations being executed via Apollo client in a given time and shows info about each operation.
This UI is using apollo-inspector library
![]()
- Helps figuring out
unwanted operationsbeing fired in render phase - Help in figuring out the reasons for
multiple re-rendersof the same watch query - Help figuring out issues with
conflicting queries - Shows field name in case
missing field error - Detailed time info lets you figure out if queries are being fired in
Waterfall modelor not. - Helps figuring out if
data is taking too much timeto get written to cache. - Shows why an operation failed
- Tracks all operations Query, Mutation, subscription, client.readQuery, client.writeQuery, cache.readQuery, cache.writeQuery, client.readFragment, client.writeFragment, cache.readFragment, cache.writeFragment.
- For each operations, below info is available
- Operation Name
- Operation Type
- Failure or Succeded
- Fetch policy
- Total execution time
- Operation queued at time
- Size in KB of the result of the Operation
- There are filters present using which, one can filter operations list
- Operation type filter (Query/Mutation/Subscription)
- Results from filter (Cache/Network)
- Operation Status (Succeeded/Failed)
- It also shows which all operations are responsible for re-rendering of an query in
Affected Queriesview - It allows you copy operations data in JSON format.
-
Select the apollo clients which needs to be tracked
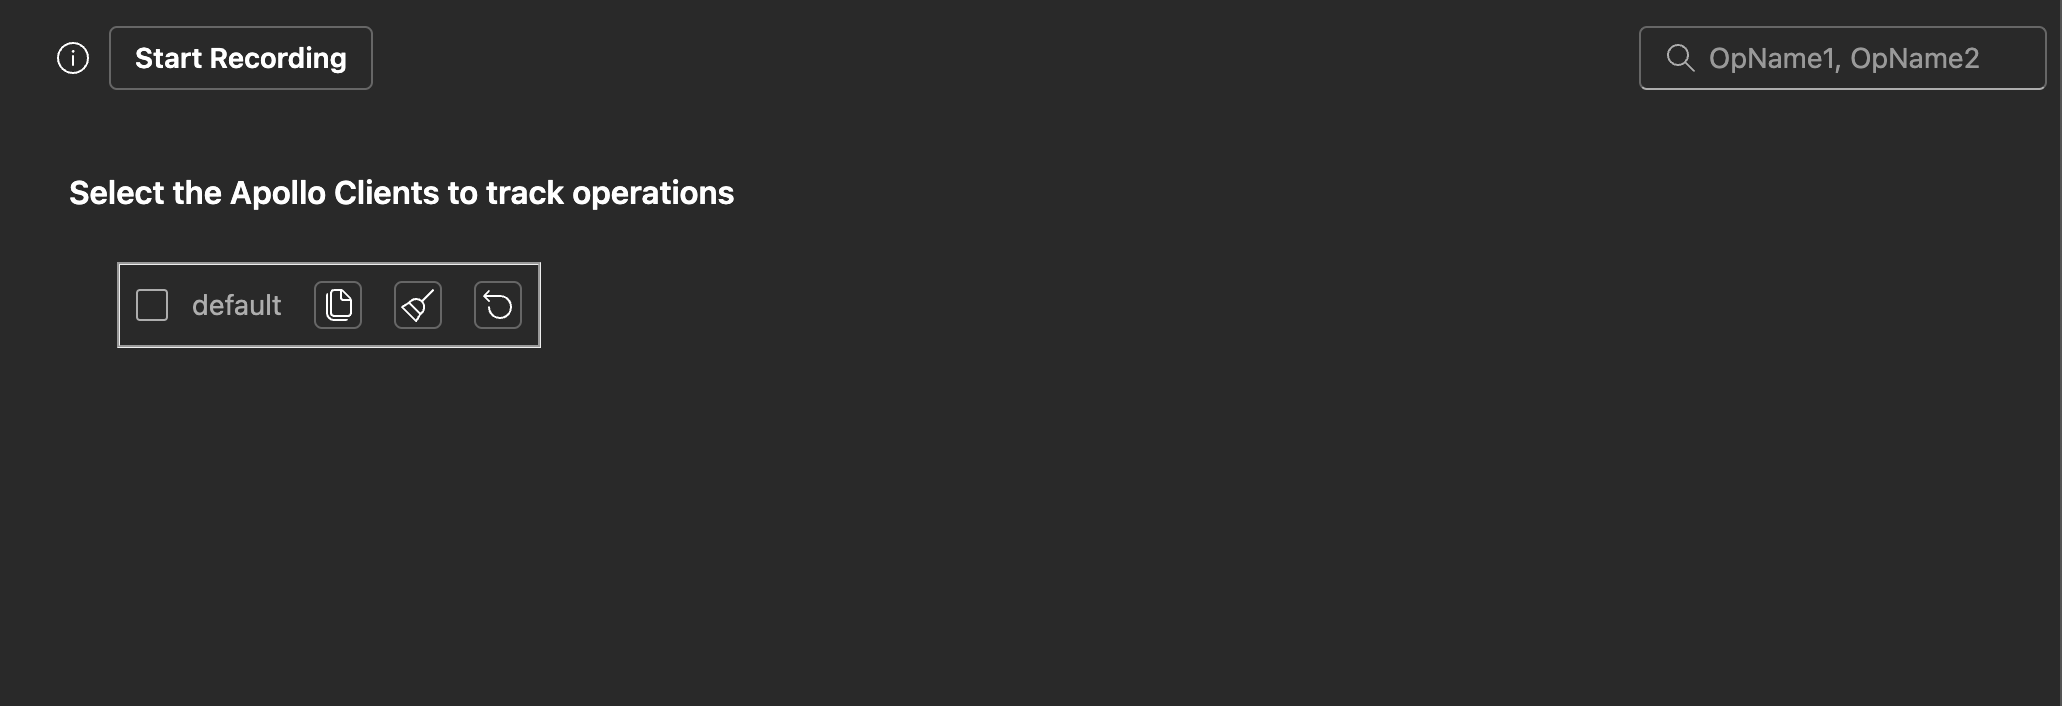
-
Click on Record button
-
Do some changes in UI.
-
It'd start showing all the on-going operations.

![]() 5. Click on a operation to see detailed view
5. Click on a operation to see detailed view
![]()
- One can select operation to copy by checking the checkboxes for each operation.
- Supports comma separate search text to search multiple operations
- Filter by Operation type (Query/Mutation/Subscription)
- Filter by from where the result is being fetched (Cache/Network)
- Filter by operation status (Succeded/Failed)
![]()
It copies all the operations which have been recorded
It copies only the current view of the operations
It copies only those operations, whose check boxes are checked
It copies the operation, which is currently opened in the detailed view
This view shows what operations led to re-render of a given query. On the left side is the list of queries which have been re-rendered and on the right side, it shows what all operation caused it.

Run yarn parcel:test:start to see the demo the tool working