Package: alinex-monitor

![]()

This application will make server management easy and fast. It will check the whole IT landscape from the host to the application.
While most monitoring tools has it's focus on the server here the focus lies on the application side, too.
- remote daemon-less analysis
- lots of sensors
- alerting and reporting
- data store for time analysis
- interactive analyzing and exploring
The monitor will analyze your whole environment in deep by connecting to the different systems in parallel and check them deeply. If a problem occurs an additional analysis step may be made to get more information. The result values will be stored in the storage database and a detailed report will be created. Based on additional action rules the report may be send by email or a web request is made. Out of the stored values time reports may be created.
It is one of the modules of the Alinex Universe following the code standards defined in the General Docs.
Install

Install the package globally using npm on a central server. From there all your machines may be checked:
sudo npm install -g alinex-monitor --production
After global installation you may directly call monitor from anywhere.
monitor --help
Because this application works agentless, you don't have to do something special on your clients but often some simple changes can make the reports more powerful. If so you will get a hint in the report.
Always have a look at the latest changes.
Usage
After the monitor and it's controllers are fully configured it may be run by only calling:
> monitor

Initializing...
Analyzing systems...
Finished.
This will start the monitor on the command line and check all controllers. All of them which make some problems will be printed on the console.
Global options:
-C, --nocolors  turn of color output
-v, --verbose   run in verbose mode
-h, --help      Show help
Check controller once
You may run the monitor to check the defined controllers once and get their status:
> monitor my-develop    # run only this controller
> monitor my-*          # run controllers with the given name prefix
> monitor               # run all controllers
You may start a try run in which nothing is stored in the storage and no action is taken.
-t --try do a try run
The verbose mode works here in multiple steps:
-v    show the controller status on console
-vv   show also the sensor status on console
-vvv  also display the result values
If no verbose mode is set only warning and error state of controller will be reported on console.
The output may look like:
> monitor -v

Initializing...
Analyzing systems...
2015-12-15 12:55:32 Controller dvb-develop => ok
Finished.

> monitor -vvv

Initializing...
Analyzing systems...
2015-12-15 12:55:51 Check load:dvb-develop => ok
2015-12-15 12:55:51 Check http:->http://192.168.200.106/svn/ => ok
2015-12-15 12:55:51 Check memory:dvb-develop => ok
2015-12-15 12:55:51 Check diskfree:dvb-develop:/ => ok
2015-12-15 12:55:51 Check diskfree:dvb-develop:/var => ok
2015-12-15 12:55:52 Check ping:localhost->192.168.200.106 => ok
2015-12-15 12:55:52 Check socket:tcp localhost->192.168.200.106:80 => ok
2015-12-15 12:55:52 Check time:dvb-develop => ok
2015-12-15 12:55:52 Check user:dvb-develop => ok
2015-12-15 12:56:01 Check cpu:dvb-develop => ok
2015-12-15 12:56:01 Check diskio:dvb-develop:sda1 => ok
2015-12-15 12:56:02 Check net:dvb-develop:eth0 => ok
2015-12-15 12:56:02 Controller dvb-develop => ok
Finished.
Run as a service
To run the controller continuously use the daemon option and start it in the
background.
> monitor -d -C > /var/log/monitor.log 2>&1 &
This will check all the controllers in the defined timerange, collect measurement values and send alerts. You may also specify some controllers to run instead of all.
Like seen above you may send the normal output to a log file but better configure a log destination through the config files (see below).
Additional commands
You may run some other commands through the interactive console or directly by giving everything on the command line call.
> monitor -c list controller
See the next section for the interactive console and their integrated help system for more details on the possible commands..
Setup
To use the controller you have to setup the whole process using some configuration files. And maybe a storage database will be used.
Exit Codes
The exit codes are arranged alongside the UNIX default:
| Code | Description |
|---|---|
| 0 | OK - no error in controller |
| 1 | General error which should not occur. |
| 2 | Fail - controller run failed |
| 3 | Warn - warning in controller run |
| 129 | SIGHUP (Signal 1) |
| 130 | SIGINT like through Ctrl + C (Signal 2) |
| 131 | SIGQUIT (Signal 3) |
| 134 | SIGABRT or SIGIOT (Signal 6) |
| 143 | SIGTERM (Signal 15) |
| 255 | Exit status out of range |
Interactive Console
You may start the interactive console by using the -i option. Additionally you
can use --json to set some presettings with default for the later interactive
call. After that you will be greeted and may give the commands:
> monitor -i # or --interactive__ ____ __###### ##### | | | \ | | ########### ##### ############# ##### | | | \ | | ############ ##### ############## ##### | | | |\ \ | | ##### ##### ############### ##### | | | | \ \| | ##### ##### ########## ##### ##### | | | |__\ | ############ ############## ##### ##### | | | \\ | ############ ############## ##### ##### |__| |______\\___| ##### ##### ########## ##### ##### ##### ##### ########## ######### ########################## ############ ##### ########## ########## ######################## ########### ##### #####___________________________________________________________________________M O N I T O R I N G A P P L I C A T I O N___________________________________________________________________________Initializing...Welcome to the interactive monitor console in which you can get moreinformation about special tools, run individual tests and explore systems.To get help call the command help and close with exit!monitor>
The following commands are possible here:
help - show a help page with all this commands
set - change general or specific settings
exit - this will close the interactive run or send Ctrl-C
Commands possible for controller, sensor, actor and explorer:
list <type> - list all possible elements of given type
show <type> <element> - show meta information for this element
run <type> <element> - run this element (maybe ask for decisions)
Examples:
list controller
show controller my_machine
set verbose 3
run controller my_machine
show sensor cpu
run sensor cpu
run explorer database
Everything the controller/sensor/actor/explorer need is asked within or before starting the process.
The interactive console uses a file based history so use the arrow keys to step in history. Also auto completion is often available try hitting the
TABkey.
Using Parameters
If you want to run the same command as on the interactive console but call it directly you can send it as command using the options:
-c --command
-j --json
As an example you may run the cleanup:
> monitor -c cleanup
Or get the list of controllers:
> monitor -c 'list controller'
If you run a command which needs optional parameters while running you have to give all of them on call as a json data object. Take the names from the interactive run displayed in front of the question.
> monitor -c run sensor cpu -j '{"remote":"localhost"}'
This will run the cpu sensor on localhost server.
Definitions
- Monitor - is the main program
- Controller - is the configurable automatic monitoring element holding some checks
- Check - will run the sensor and hold it's contents
- Sensor - will analyze some metrics and collect it's values
- Status - the current state of the element (ok, warn, fail)
- Action - will run the actor and hold the protocol
- Actor - will do some active changes on a system
- Analysis - will start an explorative check
- Analyzer - collect explorative information from a system
- Storage - will hold the results and data in a persistence layer
- Console - command line interface
- Interactive Console - will interactively work
- Daemon - service mode in which the monitor runs the controller checks continuously
Configuration
This will describe the base setup. Also needed is the controller configuration which is described in the next section. Most parts of the configuration is the base setup which is used from within the controller and sensors.
Contacts
The contacts are referenced from the controllers and are defined here in a central
file under /monitor/contacts. Entries with array are groups and objects are
address entries. Within the controller both may be used.
# Contacts for Monitoring# =================================================# This file holds a list of contacts to be used from within the rules and# specific controllers.# Groups# -------------------------------------------------operations: [aschi]# Staff# -------------------------------------------------aschi:name: Alexander Schillingposition: Developercompany: Alinex Projectemail: info@alinex.dephone: 07129/922545
Multiple phone numbers as array are possible.
The contact monitor is already defined and used as from address in emails. You
may overwrite it by defining it yourself.
Email Templates
This templates are used for sending emails out. A default template is already
defined and only needs the 'to' address. But you may define more templates under
/monitor/email:
# Email Report Configuration# =================================================# Default (extended)# -------------------------------------------------default:# already defined, so only set the 'To' address here.to: operations# Own Templates# -------------------------------------------------fail:subject: >Failed {{alias}}body: >{{name}}\n==========================================================================\n{{description}}\n\nThis test failed at {{date}}!\n\n{{hint}}\nwarn:subject: >Warning for {{alias}}body: >{{name}}\n==========================================================================\n{{description}}\n\nThis test failed at {{date}}!\n\n{{hint}}\nok:subject: >OK for {{alias}}body: >{{name}}\n==========================================================================\n{{description}}\n\nThis test failed at {{date}}!\n\n{{hint}}\n
Rules
The rules specify what to do in specific situations under /monitor/rule:
# Rule Definition# =================================================# ### Set templates for default rulesfail:email:base: failwarn:email:base: warnok:email:base: ok# ### specific checkspecific:# Only work on specific status.status: fail# Number of minimum attempts before informing.attempt: 3# Time (in seconds) to wait before informing.latency: 60# Only inform if dependent jobs not failed. This prevents of hundred of# messages if a central system failed.dependskip: true# Type of actor to run with it's configurationemail:base: fail # template to use defined under monitor/emailto: aschi # but send to myself# Timeout (in seconds) without status change before informing again.redo: 3h
Storage
If you want to store the measurement values, you need the following setup under
/monitor/storage:
# Storage settings# =================================================# There to store the results of the monitoring.database: monitorprefix: mon_# When to cleanup entries from storage# -------------------------------------------------# The values are the number of max. entries of given interval.storage:cleanup:minute: 360 # 6 hourshour: 96 # 4 daysday: 90 # 3 monthsweek: 104 # two yearsmonth: 60 # 5 years
The referenced database have to be a postgresql database here and the data
structure will be build on startup automatically. The concrete connection
settings are defined in the /database configuration, see below.
The cleanup defines how much time units to keep before removing them. Keep in mind that your database will grow if you set high values here.
Exec and Database
Also you need the setup under /exec and /database like described in
Exec and Database.
This is used in the different sensors by references to the setup stored there.
Controller
A controller is an individual part to be checked. It contains some sensors to check the system and may also depend on other controllers. Each controller is made by a specific configuration files containing meta information.
See the following example for a full controller configuration:
# Monitoring controller configuration# =================================================# This is an example of a complete controller configuration.name: Development Centerdescription: Server containing miscellaneous tools to help in the development process.# Monitor runtime configuration# -------------------------------------------------# Within the validity the same values will be used without rechecking them and# after the interval an automatic new run will be started in daemon mode.# Time (in seconds) in which the value is seen as valid and should not be rechecked.validity: 1m# Time (in seconds) to rerun the check in daemon mode.interval: 5m# Sensors to run# -------------------------------------------------# The list of dependencies are sensors which have to work to make this controller# fully work.check:- sensor: diskfree# ### Name and dependency# The name is used for identifying and also to be referred in other checks as# dependency meaning that a check only can run if all it's dependant checks are# done and don't fail.#name: mytest-3#depend: mytest-1, mytest-2# ### Specific setupconfig:remote: my-developshare: /# ### Weight setting# Specific to value of the following 'combine' setting.# With the `weight` settings on the different entries single group entries may# be rated specific not like the others. Use a number in `average` to make the# weight higher (1 is normal). Also the weight 'up' and 'down' changes the error# level for one step before using in calculation on all combine methods.#weight: down# ### Hint# Specific hint as handlebars text which may include the current results. Use# the following variables:## name: Name of the sensor# meta: Meta Information of the sensor# config: Sensor configuration# results: Results#hint: |+# ### Max Parallel checks# This goes from 1 = serial to n parallel checks running. It is wise not to use# too high values here to not make a high load on the server by the monitor itself.parallel: 5# ### Combine values# For multiple dependencies this value defines how the individual sensors are# combined to calculate the overall status:## - max - the one with the highest failure value is used# - min - the lowest failure value is used# - average - the average status (arithmetic round) is usedcombine: max# Rules to process# -------------------------------------------------# The following rules will be processed after the controller is run. They will# decide which actions to run and how to do it.## The following list references the active rules for this controller:rule:- fail- warn- ok# Information Text# -------------------------------------------------# This is a general and unspecific information text for that controller.info: |+This system is used for software development, building and deployment. Anoutage will have direct effects to the developers so that they can't submit,test and deploy their code.# ### Specific Hint# In contrast to the `info` the `hint` will be more specific to the concrete# results. Within this handlebar text you may use some specific variables:## name: controller name# config: this config# sensor: sensor resultshint: |+All necessary parts are on the same machine, so that you only have to bringthis machine to work. Backups of the data are made on my-backup.Keep in mind that the machine is in the test net and you have to use a validVPN connection for accessing.# Additional Help# -------------------------------------------------contact:operations: alexref:# system accesssubversion: http://192.168.1.6/svnnexus: http://192.168.1.6:8081/nexusJenkins: http://192.168.1.6:8080/sonarqube: http://192.168.1.6:9000/# user/developer helpdoc: https://my-docs/confluence/pages/viewpage.action?pageId=48398554#issues:#api:#code:#other:
The controller will call the sensors and collect the data. It may also generate reports or trigger specific actions.
Structure
A controller may hold some sensor but not to much. You should only group corresponding sensors within it. Dependent parts may be put in another controller, one for each level of dependency.
Each controller should have an unique and memorable name. A good structure of controllers may be:
- one for each server: name it like your machine names i.e.
vs1626,ma77234 - one for each application part i.e.
web,web1,web2,web3,ftp - one for each end user application i.e.
login,browse,buy - one overall check i.e.
all
Status
The monitor uses the following status:
running if the sensor is already analyzing, you have to wait
disabled if this controller is currently not checked - this will be used like ok for further processing
ok if everything is perfect, there nothing have to be done - exit code 0
warn if the sensor reached the warning level, know you have to keep an eye on it - exit code 1
fail if the sensor failed and there is a problem - exit code 2
Sensor
An sensor is a code module which allows to check specific parts of the system. It will analyze the system and get some measurement values back.
Each use of a sensor in an controller with specific setup data is further called a check.
A check consists of the following setup:
- sensor - the name of the sensor to use
- name - an optional alias name for referencing (optional)
- depend - other checks which should run before (optional)
- config - the configuration to run it
- weight - change setting belongs to the controllers combine setting (optional)
- hint - a technical hint to find or resolve the problem (optional)
Config
Each sensor has its own configuration settings like seen above in the controller configuration. The common keys are:
- warn - the javascript code to check if status should be set to warn
- fail - the javascript code to check if status should be set to fail
Meta Data
The following meta data are available:
- title
- description
- category - one of 'sys', 'net', 'srv'
- hint - additional help for problems
Result
After running a sensor you get a result object containing:
- date - array with start and end date of run
- status - one of: 'ok', 'warn', 'fail' ('running')
- message - optional, explaining the status
- values - object containing specific values
System Sensors
CPU
Checking the CPU utilization of all cores together. With the configuration values:
- remote - the remote server, there to run the sensor
- time - measurement time in seconds
- warn - the javascript code to check for warn status (default: 'active >= 100%')
- fail - the javascript code to check for fail status
The resulting report part may look like:
CPU localhost--------------------------------------------------------------------------------Check the current activity in average percent of all cores.::: info- __STATUS: ok__ at Wed Dec 23 2015 16:04:31 GMT+0100 (CET):::Last check results from Wed Dec 23 2015 16:04:31 GMT+0100 (CET) are:| NAME | LABEL | VALUE ||:------ |:---------------- | --------:|| cpus | CPU Cores | 8 || speed | CPU Speed | 3.61 GHz || user | User Time | 3.7 % || system | System Time | 0.68 % || idle | Idle Time | 95 % || active | Activity | 5.1 % || wait | I/O Wait Time | 0.71 % || low | Lowest CPU Core | 1.9 % || high | Highest CPU Core | 8.2 % |> A high CPU usage means that the server may not start another task immediately.> If the load is also very high the system is overloaded, check if any application> goes evil.### ConfigurationThe cpu sensor is configured with:| CONFIGURATION SETTING | VALUE ||:--------------------- |:-------------- || time | 10 || warn | active >= 100% |
Load
Check the system load in the last time ranges. With the configuration values:
- remote - the remote server, there to run the sensor
- time - measurement time in seconds
- warn - the javascript code to check for warn status
- fail - the javascript code to check for fail status
The resulting report part may look like:
Load localhost--------------------------------------------------------------------------------Check the local processor activity over the last minute to 15 minutes.::: info- __STATUS: ok__ at Wed Dec 23 2015 16:14:11 GMT+0100 (CET):::Last check results from Wed Dec 23 2015 16:14:11 GMT+0100 (CET) are:| NAME | LABEL | VALUE ||:------ |:---------- | -----:|| short | 1min Load | 4.8 % || medium | 5min Load | 5.1 % || long | 15min Load | 8.4 % |> A very high system load makes the system irresponsible or really slow. Mostly> this is CPU-bound load, load caused by out of memory issues or I/O-bound load> problems.### ConfigurationThe load sensor is configured with:| CONFIGURATION SETTING | VALUE ||:--------------------- |:------------ || warn | short > 500% |
Memory
Check the memory usage on the system
- remote - the remote server, there to run the sensor
- warn - the javascript code to check for warn status
- fail - the javascript code to check for fail status
The resulting report part may look like:
Memory localhost--------------------------------------------------------------------------------Check the free and used memory.::: info- __STATUS: ok__ at Wed Dec 23 2015 16:14:11 GMT+0100 (CET):::Last check results from Wed Dec 23 2015 16:14:11 GMT+0100 (CET) are:| NAME | LABEL | VALUE ||:--------------- |:----------------- | --------:|| total | Total | 8.05 GB || used | Used | 7.71 GB || free | Free | 318 MiB || shared | Shared | 0.899 GB || buffers | Buffers | 300 MiB || cached | Cached | 2.34 GB || swapTotal | Swap Total | 8.26 GB || swapUsed | Swap Used | 1.84 GB || swapFree | Swap Free | 6.42 GB || actualFree | Actual Free | 2.99 GB || percentFree | Percent Free | 37 % || swapPercentFree | Swap Percent Free | 78 % |> Check which process consumes how much memory, maybe some processes have a> memory leak.### ConfigurationThe memory sensor is configured with:| CONFIGURATION SETTING | VALUE ||:--------------------- |:--------- || warn | free < 1% |
Diskfree
This sensor will check the disk usage on a specific block device. The configuration allows:
- remote - the remote server, there to run the sensor
- share - the disk share's path or mount point to check
- warn - the javascript code to check for warn status
- fail - the javascript code to check for fail status (default: 'free is 0')
- timeout - the time the whole test may take before stopping
The resulting report part may look like:
Diskfree localhost:/--------------------------------------------------------------------------------Test the free diskspace of one share.::: info- __STATUS: ok__ at Wed Dec 23 2015 16:04:55 GMT+0100 (CET):::Last check results from Wed Dec 23 2015 16:04:55 GMT+0100 (CET) are:| NAME | LABEL | VALUE ||:----------- |:---------- | ------------------------------------------------------:|| share | Share | /dev/disk/by-uuid/c9492a0b-b280-43de-9882-c845cbecdadf || type | Type | ext4 || mount | Mountpoint | / || total | Available | 0.926 TB || used | Used | 383 GiB || usedPercent | % Used | 44 % || free | Free | 479 GiB || freePercent | % Free | 56 % |> If a share is full it will make I/O problems in the system or applications in> case of the root partition it may also neither be possible to log errors. Maybe> some old files like temp or logs can be removed or compressed.### ConfigurationThe diskfree sensor is configured with:| CONFIGURATION SETTING | VALUE ||:--------------------- |:----------------- || share | / || timeout | 5000 || warn | freePercent < 10% || fail | free is 0 |
DiskIO
This sensor will check the disk io traffic:
- remote - the remote server, there to run the sensor
- device - the disk device name
- time - measurement time in seconds
- warn - the javascript code to check for warn status
- fail - the javascript code to check for fail status
The resulting report part may look like:
Disk IO localhost:sda--------------------------------------------------------------------------------Check the disk io traffic.::: info- __STATUS: ok__ at Wed Dec 23 2015 16:13:46 GMT+0100 (CET):::Last check results from Wed Dec 23 2015 16:13:46 GMT+0100 (CET) are:| NAME | LABEL | VALUE ||:---------- |:----------------- | --------:|| write | Write operation/s | 11.6 || writeSize | Write/s | 482 KiB || readTotal | Total Read | 57.4 GiB || writeTotal | Total Write | 207 GiB || writeTime | Write Time/s | 43 ms |> If there are any problems here check the device for hardware or network> problems.### ConfigurationThe diskio sensor is configured with:| CONFIGURATION SETTING | VALUE ||:--------------------- |:----- || device | sda || time | 10 |
Net
This sensor will check the network traffic on a specified interface:
- remote - the remote server, there to run the sensor
- interface - the interface to analyze
- time - measurement time in seconds
- warn - the javascript code to check for warn status (default: 'errors > 50%')
- fail - the javascript code to check for fail status (default: 'errors > 99%')
The resulting report part may look like:
Network Traffic localhost:eth0--------------------------------------------------------------------------------Check the network traffic.::: info- __STATUS: ok__ at Wed Dec 23 2015 16:14:11 GMT+0100 (CET):::Last check results from Wed Dec 23 2015 16:14:11 GMT+0100 (CET) are:| NAME | LABEL | VALUE ||:--------------- |:------------------- | -------------------------:|| receivedBytes | Receive Transfer | 22 KiB || receivedPackets | Received Packets | 68 || transmitBytes | Transmit Transfer | 16.5 KiB || transmitPackets | Transmitted Packets | 63 || bytes | Total Transfer | 38.5 KiB || packets | Total Packets | 131 || state | Interface State | UP || mac | Mac Address | 40:a8:f0:46:e5:76 || ipv4 | IP Address | 192.168.5.113 || ipv6 | IPv6 Address | fe80::42a8:f0ff:fe46:e576 |> If you see a high volume it may be overloaded or a attack is running.### ConfigurationThe net sensor is configured with:| CONFIGURATION SETTING | VALUE ||:--------------------- |:------------ || interface | eth0 || time | 10 || warn | errors > 50% || fail | errors > 99% |
Time
This sensor will check the network traffic on a specified interface:
- remote - the remote server, there to run the sensor
- host - the name of an NTP server to call (default: pool.ntp.org)
- port - the port to use for NTP calls (default: 123)
- timeout - the time in milliseconds to retrieve time
- warn - the javascript code to check for warn status (default: 'diff > 10000')
- fail - the javascript code to check for fail status
The resulting report part may look like:
Time Check localhost--------------------------------------------------------------------------------Check the system time against the Internet.::: info- __STATUS: ok__ at Wed Dec 23 2015 16:14:50 GMT+0100 (CET):::Last check results from Wed Dec 23 2015 16:14:50 GMT+0100 (CET) are:| NAME | LABEL | VALUE ||:---- |:---------- | ------:|| diff | Difference | 0.62 s |> If the time is not correct it may influence some processes which goes over> multiple hosts. Therefore install and configure `ntpd` on the machine.### ConfigurationThe time sensor is configured with:| CONFIGURATION SETTING | VALUE ||:--------------------- |:------------ || host | pool.ntp.org || port | 123 || timeout | 10000 || warn | diff > 10000 |
User
This sensor will analyse processes started from a specific user:
- remote - the remote server, there to run the sensor
- user - the user name to analyze
- warn - the javascript code to check for warn status (default: 'diff > 10000')
- fail - the javascript code to check for fail status
The resulting report part may look like:
Active User localhost--------------------------------------------------------------------------------Check what an active user do.::: info- __STATUS: ok__ at Wed Dec 23 2015 16:14:50 GMT+0100 (CET):::Last check results from Wed Dec 23 2015 16:14:50 GMT+0100 (CET) are:| NAME | LABEL | VALUE ||:------ |:--------------- | -------:|| num | Processes | 96 || cpu | % CPU | 3.9 % || memory | % Memory | 58 % || rss | Physical Memory | 118 MiB || vss | Virtual Memory | 4.88 MB |> This check will give an overview of the activities of an (logged in) user. If> you look at the processes you may find out that some other warnings like high> load are user made and you may contact this person directly.### ConfigurationThe user sensor is configured with:| CONFIGURATION SETTING | VALUE ||:--------------------- |:----- || user | alex |
Network Sensors
Ping
Although simple, but important to check if a host is responding to ICMP ping packets. Thus, it is possible to measure the availability of a server, as well as the response time and packet loss:
- remote - the remote server, there to run the sensor
- host - the server hostname or ip address to be called for ping
- count - the number of ping packets to send, each after the other (default: 1)
- interval - the time to wait between sending each packet (default: 1s)
- size - the number of bytes to be send, keep in mind that 8 bytes for the ICMP header are added (default: 24B)
- timeout - the time in milliseconds the whole test may take before stopping and failing it (default: 1s)
- warn - the javascript code to check for warn status (default: 'quality < 100%')
- fail - the javascript code to check for fail status (default: 'quality is 0')
Ping localhost->193.99.144.80--------------------------------------------------------------------------------Test the reachability of a host in an IP network and measure the round-trip timefor the messages send.::: info- __STATUS: ok__ at Thu Dec 24 2015 08:59:40 GMT+0100 (CET):::Last check results from Thu Dec 24 2015 08:59:40 GMT+0100 (CET) are:| NAME | LABEL | VALUE ||:------------ |:------------------ | -------:|| responseTime | Avg. Response Time | 15.3 ms || responseMin | Min. Respons Time | 15.3 ms || responseMax | Max. Response Time | 15.3 ms || quality | Quality | 100 % |__Result:__PING 193.99.144.80 (193.99.144.80) 56(84) bytes of data.64 bytes from 193.99.144.80: icmp_seq=1 ttl=244 time=15.3 ms--- 193.99.144.80 ping statistics ---1 packets transmitted, 1 received, 0% packet loss, time 0msrtt min/avg/max/mdev = 15.354/15.354/15.354/0.000 ms
Check the network card configuration if local ping won't work or the network connection for external pings. Problems can also be that the firewall will block the ping port.
Configuration
The ping sensor is configured with:
| CONFIGURATION SETTING | VALUE |
|---|---|
| host | 193.99.144.80 |
| count | 1 |
| interval | 1000 |
| size | 56 |
| timeout | 1000 |
| warn | quality < 100% |
| fail | quality is 0 |
### Socket

This sensor will ping another host:

- remote - the remote server, there to run the sensor
- host - the server hostname or ip address to be called for ping
- port - the port number used to connect to
- transport - the protocol used for internet transport layer (default:tcp)
- warn - the javascript code to check for warn status (default: 'quality < 100%')
- fail - the javascript code to check for fail status (default: 'quality is 0')

``` text
Socket tcp localhost->193.99.144.80:80
--------------------------------------------------------------------------------

Use TCP sockets to check for the availability of a service behind a given port.

::: info
- __STATUS: ok__ at Wed Dec 23 2015 16:14:45 GMT+0100 (CET)
:::

Last check results from Wed Dec 23 2015 16:14:45 GMT+0100 (CET) are:

| NAME         | LABEL         | VALUE |
|:------------ |:------------- | -----:|
| responseTime | Response Time |   1 s |

> On problems the service may not run or a network problem exists.

### Configuration

The socket sensor is configured with:

| CONFIGURATION SETTING | VALUE         |
|:--------------------- |:------------- |
| host                  | 193.99.144.80 |
| port                  | 80            |
| transport             | tcp           |
| timeout               | 2000          |
Http
This sensor will ping another host:
- remote - the remote server, there to run the sensor
- url - the URL to request
- timeout - the timeout in milliseconds till the process is stopped and be considered as failed
- username - the name used for basic authentication
- password - the password used for basic authentication
- match - the substring or regular expression which have to match
- warn - the javascript code to check for warn status
- fail - the javascript code to check for fail status (default: 'statusCode < 200 or statusCode >= 400')
If a remote server reference is given this will be used for tunneling over ssh as proxy.
Within the match parameter you may use named-captures in the form (:regexp). If you do so you will get a named object instead of an array as result.
HTTP Request ->http://heise.de--------------------------------------------------------------------------------Connect to an HTTP or HTTPS server and check the response.::: info- __STATUS: ok__ at Wed Dec 23 2015 21:26:14 GMT+0100 (CET):::Last check results from Wed Dec 23 2015 21:26:14 GMT+0100 (CET) are:| NAME | LABEL | VALUE ||:------------- |:-------------- | ------------------------:|| responseTime | Response Time | 320 ms || statusCode | Status Code | 200 || statusMessage | Status Message | OK || server | Server | nginx || contentType | Content Type | text/html; charset=utf-8 || length | Content Length | 177 KiB |__Request:__``` textGET http://heise.deUser-Agent: Alinex Monitor through request.js
Response:
server: nginxcontent-type: text/html; charset=utf-8x-cobbler: octo09.heise.dex-clacks-overhead: GNU Terry Pratchettlast-modified: Wed, 23 Dec 2015 20:26:07 GMTexpires: Wed, 23 Dec 2015 20:26:39 GMTcache-control: public, max-age=32transfer-encoding: chunkeddate: Wed, 23 Dec 2015 20:26:15 GMTage: 8connection: keep-alivevary: User-Agent,Accept-Encoding,X-Forwarded-Proto,X-Export-Format,X-Export-Agent
Body:
heise online - IT-News, Nachrichten und Hintergründe
If the server didn't respond it also may be a network problem.
Configuration
The http sensor is configured with:
| CONFIGURATION SETTING | VALUE |
|---|---|
| url | http://heise.de |
| timeout | 10000 |
| fail | statusCode < 200 or statusCode >= 400 |
### Ftp

To be written...

- put
- read
- move
- delete
- responseTime

### SFtp

To be written...

- put
- read
- move
- delete
- responseTime

### SNMP

To be written...

Makes monitoring any network device like printer... possible.

### IPMI

### Certificate

To be written...

- validTime
- keySize


Daemon Sensors
-------------------------------------------------

### PID

To be written...

cat /proc/PID/cmdline
cat /proc/PID/status

### PostgreSQL

To be written...

https://wiki.postgresql.org/wiki/Monitoring

analysis:
- pid sensor

### Apache

To be written...

mod_status:

- The number of worker serving requests
- The number of idle worker
- A total number of accesses and byte count served (*)
- The time the server was started/restarted and the time it has been running for
  Averages giving the number of requests per second, the number of bytes served per second and the average number of bytes per request (*)

analysis:
- The current hosts and requests being processed (*)
- pid sensor

### Tomcat

To be written...

Maybe use JMX... https://www.npmjs.com/package/jmx

analysis:
- pid sensor

### Wowza

To be written...

Parsing stats page

analysis:
- pid sensor

### VMWare

To be written...

http://searchitchannel.techtarget.com/feature/Monitoring-vSphere-performance-with-command-line-tools


Data Sensors
-------------------------------------------------

### Log

To be written...

- filter
- timerange

- num lines
- filtered lines
- comment

- list of lines

### Database

This sensor will get some measurement values from the database:

- database - alias name of the database to use
- query - the query to run
- timeout - maximum time to run the query (default: 10s)

``` text
Database test-postgresql:SELECT 100 as num, 'just a...
--------------------------------------------------------------------------------

Run a query on the database to chech a value like count of entries in the
database.

::: info
- __STATUS: ok__ at Wed Dec 23 2015 16:04:54 GMT+0100 (CET)
:::

Last check results from Wed Dec 23 2015 16:04:54 GMT+0100 (CET) are:

| NAME         | LABEL         |         VALUE |
|:------------ |:------------- | -------------:|
| data         | Data.num      |           100 |
| data         | Data.comment  | just a number |
| responseTime | Response Time |        1.23 s |

### Configuration

The database sensor is configured with:

| CONFIGURATION SETTING | VALUE                                         |
|:--------------------- |:--------------------------------------------- |
| database              | test-postgresql                               |
| query                 | SELECT 100 as num, 'just a number' as comment |
| timeout               | 10000                                         |
Database Stats
Database Queue
REST
To be written...
Simulation Sensors
Web Session
To be written...
Streaming
To be written...
Storage
The controllers will hold some information in memory but store all values also in a database for long time analysis. This includes the following information:
- sensor values in different intervals for specified timeframe
- status changes in sensors and controller with date
- action log
- last explorer information per element config
The database structure therefore looks like:
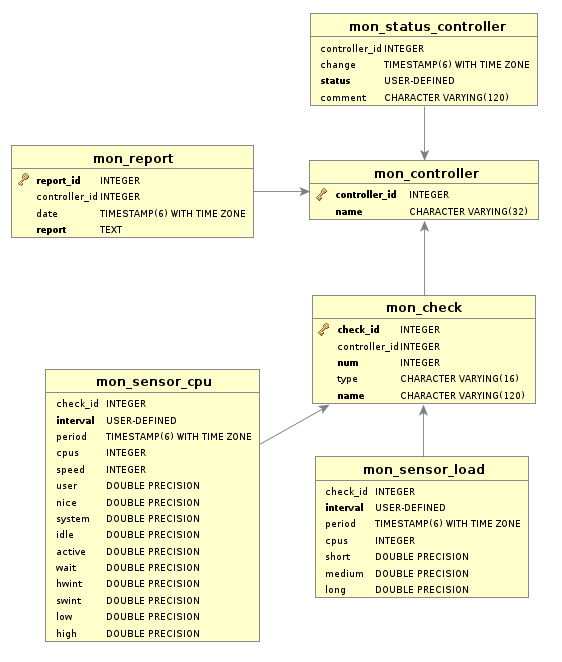
To get easy to view report diagrams out of this you may use the dbVisualizer tool. First make a script to select the values you want to display:
SELECT * FROM controllerLEFT JOIN check USING (controller_id)RIGHT JOIN sensor_cpu USING (check_id)WHERE controller.name='my-develop' AND interval='hour'ORDER BY period
In the result you may switch to graphical view and select the rows to display.
To keep the data volume low old values will be removed.
Actor
The controller may do some actions:
- inform on console/log (each analyzation)
- inform per email (on state change)
- send web request (on state change)
- try to repair (not implemented, yet)
All these are triggered using the configuration rules described above.
Explorer
The explorer modules are used for exploratory analyzation with the given data or by interactively requesting for answers. They are a scriptable tool to gather information and analyze them.
In contrast to the sensor it will retrieve also a lot of more static or seldom changing information and may take a lot more time to execute. It will also run with lower priority on the server. Multiple parallel analysis is also possible on some of the explorers leading to a comparison or overview report.
To run them use the interactive console or give all details to the cli as a json object.
If you want to have the report as email give -m <address> as parameter on the
monitor startup.
Hardware
- lshw -json
- dmidecode
- lscpu lspci lsusb cat /proc/cpuinfo cat /proc/diskstats
run by step only if before failed and add to result.hint
OS
cat /proc/version
Services
running daemons (exclude system ones)
Network Settings
/proc/sys/kernel/domainname /proc/sys/kernel/hostname ? firewall
ApacheSites
TomcatApps
Upgrade
Database
Cron Schedule
config date from-to (default today) time from-to
crontab -l sort by time split alternatives into multiple entries split from to into multiple entries
Plugin System
To extend the monitor with your own sensors, analyzers and actors you have the possibility to create your own package with them.
Include and Use
To include your own plugins you have to install them using npm and then add
them in the /monitor/plugins list of your configuration file.
npm install my-plugin

...
plugins:
  - my-plugin
...
After that you can use them in your controller or analyzation run as if they are internal ones by name.
Plugin Structure
Each plugin may have the following methods in the main module:
- listSensor(cb) -> calling cb(err, map)
- listActor(cb) -> calling cb(err, map)
- listExplorer(cb) -> calling cb(err, map)
This methods should return a map of elements with name: require path within the
module like cpu: 'sensor/cpu'.
The elements returned need the same API as in the main package (see below).
Sensor Structure
A sensor should be a module exporting the following objects:
- schema - an alinex-validator compatible definition to validate its check configuration
- meta - object containing meta data like:
- title
- description
- category - like 'sys', 'net', 'app'
- hint - handlebar template possible
- values - the values which the sensor will return
- title
- description
- type - one of 'string', 'integer', 'float', 'interval', 'byte', 'percent', 'array', 'object'
- unit - optional unit of values if number type used
- init(cb) - initialize the check once
- prerun(cb) - method to be called before each run (optional)
- run(cb) - runing the acquisition of data
- calc(cb) - calculating the values from the result set
- mapping(name) - access a mapped field definition (database sensor only)
- report - create an additional detail report from the results (optional)
Actor Structure
Coming soon...
Explorer Structure
Like the sensor it needs a schema definition for all values needed in the process. In interactive mode the explorer it will ask for them then needed. Therefore the structure is nearly the same as for a sensor:
- schema - possible values needed as alinex-validator compatible definition
- meta - object containing meta data like:
- title
- description
- category - like 'sys', 'net', 'app'
- hint - handlebar template possible
- values - the values which the sensor will return
- title
- description
- type - one of 'string', 'integer', 'float', 'interval', 'byte', 'percent', 'array', 'object'
- unit - optional unit of values if number type used
- name(config) - a method returning a configuration based short name to identify
- run(config, cb) - will run this explorer with given configuration or interactively if no config given
Roadmap
I will try to release a first stable version in December 2015. This will have:
- a working cli syntax - done
- the interactive console - done
- possibility to run onetime analyzation - done
- database storage support - done
- daemon mode running controller on schedule - done
- modular base design -done
The next version coming early in 2016 will have:
- tested in productive environment
- alerting with mail actor
- fully working explorers
After that a lot of bug fixes, smaller improvements and more sensors, actors and explorers will follow.
License
Copyright 2015 - 2016 Alexander Schilling
Licensed under the Apache License, Version 2.0 (the "License"); you may not use this file except in compliance with the License. You may obtain a copy of the License at
Unless required by applicable law or agreed to in writing, software distributed under the License is distributed on an "AS IS" BASIS, WITHOUT WARRANTIES OR CONDITIONS OF ANY KIND, either express or implied. See the License for the specific language governing permissions and limitations under the License.