region-labels
This package is aimed to algorithmically generate labels for two-dimensional geographic regions which will best adapt to the shape and size of the region.
JSFiddle Demo
Here is a JSFiddle demo: https://jsfiddle.net/sikanrong/8304Lpvr/
Change log
June 14, 2019
- Adding support for DBSCAN clustering. The algorithm can now automatically detect clusters of shapes within a feature and label each cluster separately.
- Massive cleaning of the code; using proper ES6 class structure and import/export syntax. Breaking up this giant monolith into smaller pieces and spreading it out across more source-files.
- Proper scoping of member variables within the two main classes of the library.
- Migrate the project to WebPack and babel instead of using browserify.
- Use AVA test framework instead of the tape package.
- Adding more tests for the DBSCAN functionality, as well as cleaning up the tests a lot by externalizing the expected test results into their own file.
Documentation
constructor
RegionLabel class constructor takes a GeoJSON object as the fist parameter, and an options object as the second.
The GeoJSON object can either be a single Feature, or a FeatureCollection. By default, if a FeatureCollection is given, each feature will be labelled individually.
Only geometry of type Polygon and MultiPolygon are supported.
The following options are accepted:
- margin - accepts an integer of how many pixels to leave as margin between the label and the edge of the canvas
- canvasDims - the dimensions of the desired label must be passed in as options so that the given geography and label can be centered within those dimensions
- canvas - optionally an existing canvas of desired size can be passed instead of canvasDims
- label - the desired label for the region. label can either be a string, or a callback function which takes the properties object of each feature and returns the desired label.
{label: (_props) => {return _props.NAME}}- excludeFeatures - A function to which the properties of each Feature is passed. If the function returns true, that feature will be excluded from the labeling; e.g. the label will actively avoid that feature and label the rest as a group. Useful for countries or administrative areas landlocked entirely within some other single region.
{excludeFeatures: (_props) => {
    return (_props.LAND_AREA > 3.5);
}}-
forceSingleLabel - if set to
true, it will treat all features in the FeatureCollection as a single shape and generate a single label for all features. Defaults tofalse. -
dbscanClustering - if set to
true, the DBSCAN algorithm is used to automatically create groupings of shapes within a feature, and label them separately. Defaults tofalse. -
dbscanPointDensity - The algorithm will overlay the geographies with a point grid to perform DBSCAN clustering. This parameter controls the density of the points of this grid, which will hold (
dbscanPointDensity)² points. Defaults to10. -
dbscanMinPoints - The minimum number of points for the DBSCAN algorithm to consider that cluster as part of a labelling-group. Defaults to
2. -
dbscanRadiusScale - The clustering radius for the DBSCAN algorithm is by default set as the greatest distance between points on the grid, multiplied by
dbscanRadiusScale. Defaults to2.
drawLabels
The drawLabels function will draw all of the generated labels to a canvas, and return that canvas.
var labelCanvas = rl.drawLabels();
//Draws the generated labels to some other canvas
ctx.drawImage(labelCanvas, 0, 0);
drawGeometries
The drawGeometries function will draw all of the passed GeoJSON to a canvas and return that canvas.
var geometryCanvas = rl.drawGeometries();
ctx.drawImage(geometryCanvas, 0, 0);
debugDraw
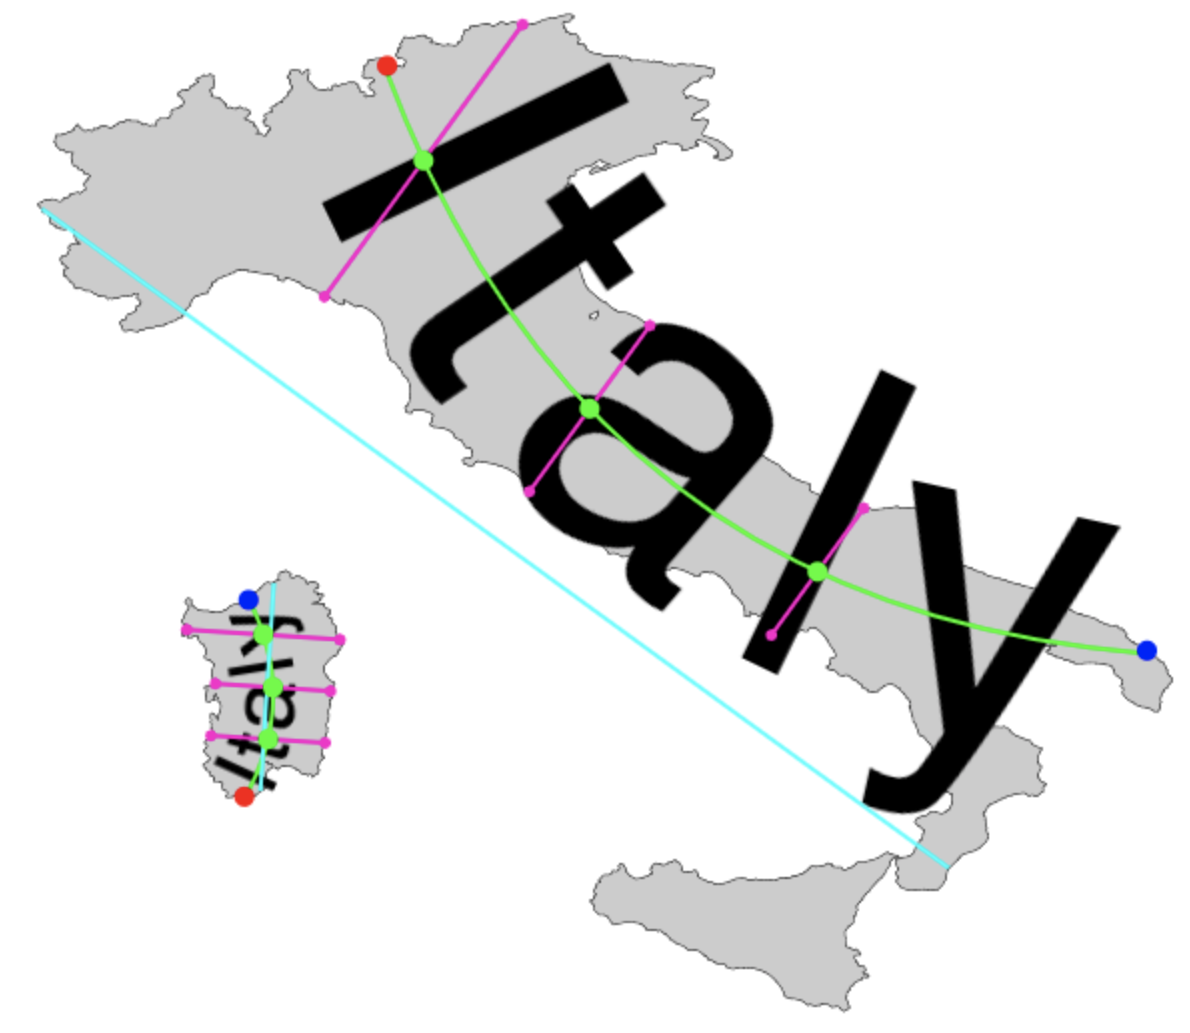
This will return a canvas with some colored lines and points which are mathematically meaninful in terms of how final the label spline is calculated. Primarily used for debugging; useful as an overlay atop the label/geometry data.
var debugCanvas = rl.debugDraw();
ctx.drawImage(debugCanvas, 0, 0);
Tests
Run tests just by executing
npm run testTAP version 13
# should use DBSCAN to correctly separate USA into logical labeling groups
ok 1 - should use DBSCAN to correctly separate USA into logical labeling groups
# should generate labels for all test geographies without issue
ok 2 - should generate labels for all test geographies without issue
# should generate correct label data for Texas
ok 3 - should generate correct label data for Texas
# should generate correct label data for New Jersey
ok 4 - should generate correct label data for New Jersey
# should generate correct label data for Hawaii
ok 5 - should generate correct label data for Hawaii
# should generate correct label data for Russia. Should wrap Iultinsky District
ok 6 - should generate correct label data for Russia. Should wrap Iultinsky District
1..6
# tests 6
# pass 6
# fail 0
Authors
Written in Barcelona and Santa Cruz de Tenerife, Spain. 2017-2019
Alexander Pilafian <sikanrong@gmail.com>
Aleksandra Gabka <rivvel@gmail.com>