


[!NOTE] This is one of 192 standalone projects, maintained as part of the @thi.ng/umbrella monorepo and anti-framework.
🚀 Please help me to work full-time on these projects by sponsoring me on GitHub. Thank you! ❤️
Conversion and preparation of thi.ng/geom shapes & shape groups to/from AxiDraw pen plotter draw commands. This is a support package for @thi.ng/geom.
This package only deals with the (bi-directional) conversion aspects between geometry and plotter commands. The @thi.ng/axidraw package is responsible for the actual plotter output...
| Shape type | Remarks |
|---|---|
| arc | elliptic arc(1) |
| circle | circle(1) |
| cubic | cubic bezier segment(1) |
| ellipse | ellipse(1) |
| group | shape group (possibly nested)(3) |
| line | line segment(2) |
| path | single outline only, no holes |
| points | point cloud (stippling)(3) |
| polyline | polyline (any number of vertices)(2) |
| polygon | simple polygon, no holes(2) |
| quad | arbitrary 4-gon(2) |
| quadratic | quadratic bezier segment(1) |
| rect | axis aligned rectangle(2) |
| triangle | triangle(2) |
- (1) always interpolated/sampled
- (2) only interpolated if forced via attrib
- (3) supports command sequence interleaving
All
thi.ng/geom
shape types have support for arbitrary attributes. Different support packages
can then utilize these attribs to customize usage or behaviors. In this case,
any package-specific attribs must be stored under the __axi key:
-
clip: Optional clip polygon vertices (if given only the parts of strokes inside that polygon will be plotted) -
delayDown: Shape specific delay (in ms), i.e. initial hold time for the stroke or when stippling... -
delayUp: Delay for pen up command at the end this particular shape/polyline/point. -
down: Pen down position (in %) for this particular shape/polyline. Will be reset to globally configured default at the end of the shape. -
speed: Speed factor (multiple of globally configured draw speed). Depending on pen used, slower speeds might result in thicker strokes. -
skip: Only used for groups or point clouds. If given, only every (n+1)th child shape or point is being processed and the others ignored. Useful for low detail test runs. -
sort: Ordering function (in lieu of full path planning/optimization, which is planned for a later stage). For shapes other thanpoints(), order of appearance is used by default. -
interleave: Currently only supported for point clouds. See Supporting custom drawing tools.
import { circle } from "@thi.ng/geom";

// a circle which will be plotted at only 10% of the normal speed
circle(100, { __axi: { speed: 0.1 } })Since many of the supported shapes are not inherently vertex-based, their
boundaries/outlines need to be sampled when they are being converted to
polylines. Therefore, in addition to the above attributes, the thi.ng/geom
package itself also makes use of the __samples attribute to control the
re-sampling of individual shapes. Please see the following links for more
details and supported options:
As mentioned above, the default draw order for shapes within a group is order of appearance. For point clouds, the {@link pointsByNearestNeighbor} ordering function is used by default, which attempts to minimize travel distance between points.
Currently, the following ordering functions are available, but custom implementations can be provided too...
For debug, optimization & visualization purposes it's useful to convert a
sequence of plotter commands back into 2D geometry. This can be done via the
supplied
asGeometry()
function, which also takes several options to customize the resulting output.
One of the examples below is demonstrating basic usage.
The main function of this package is the polymorphic function
asAxiDraw(),
which converts any of the supported shape types into an iterable of
thi.ng/axidraw
drawing commands. This conversion happens semi-lazily (via generator
functions) to minimize memory usage and spread out the computational load of the
conversions.
The below example can be directly launched via node cubics.js (obviously
provided you have an AxiDraw connected and all listed packages installed):
(Result: https://mastodon.thi.ng/@toxi/109473655772673067)
import { AxiDraw } from "@thi.ng/axidraw";
import { asCubic, group, pathFromCubics, star } from "@thi.ng/geom";
import { asAxiDraw } from "@thi.ng/geom-axidraw";
import { map, range } from "@thi.ng/transducers";

(async () => {
    // create group of bezier-interpolated star polygons,
    // with each path using a slightly different configuration
    const geo = group({ translate: [100, 100] }, [
        ...map(
            (t) =>
                pathFromCubics(
                    asCubic(star(90, 6, [t, 1]), {
                        breakPoints: true,
                        scale: 0.66,
                    })
                ),
            range(0.3, 1.01, 0.05)
        ),
    ]);

    // connect to plotter
    const axi = new AxiDraw();
    await axi.connect();
    // convert geometry to drawing commands & send to plotter
    await axi.draw(asAxiDraw(geo, { samples: 40 }));
})();(Result: https://mastodon.thi.ng/@toxi/109483553358349473)
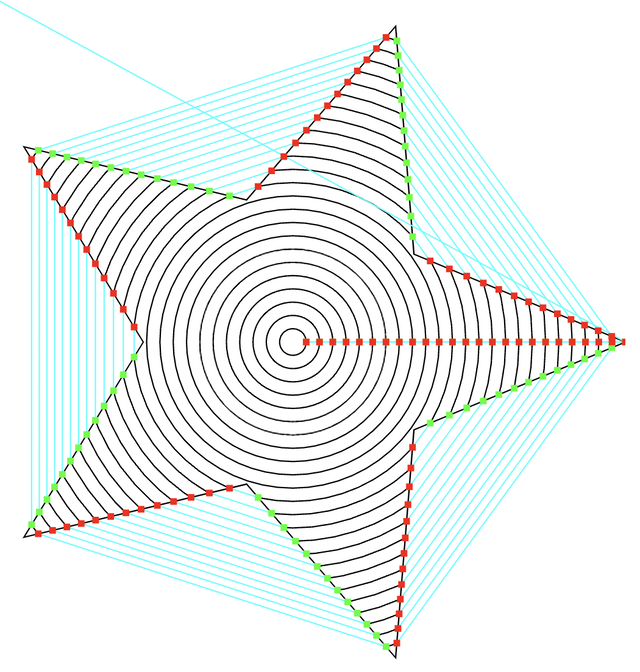
import { AxiDraw } from "@thi.ng/axidraw";
import {
    asSvg,
    circle,
    group,
    starWithCentroid,
    svgDoc,
    vertices,
} from "@thi.ng/geom";
import { asAxiDraw, asGeometry } from "@thi.ng/geom-axidraw";
import { map, range } from "@thi.ng/transducers";
import { writeFileSync } from "fs";

(async () => {
    const origin = [100, 100];
    const radius = 50;
    const boundary = starWithCentroid(origin, radius, 5, [1, 0.45], { __axi: { speed: 0.25 } });
    // group of concentric circles using boundary as clip polygon
    const geo = group({}, [
        boundary,
        group({ __samples: 60, __axi: { clip: vertices(boundary) } }, [
            ...map((r) => circle(origin, r), range(2, radius, 2)),
        ]),
    ]);

    // convert into AxiDraw command sequence
    const commands = [...asAxiDraw(geo)];

    // now visualize command sequence (convert back to geometry, incl. pen movements)
    const { paths, rapids, ups, downs } = asGeometry(commands);
    // write visualization as SVG
    writeFileSync(
        "export/clipping-commands.svg",
        asSvg(svgDoc({ width: 600, weight: 0.2 }, paths, rapids, ups, downs))
    );

    // actually connect & send to plotter
    const axi = new AxiDraw();
    await axi.connect();
    await axi.draw(commands);
})();AxiDraw (and other pen plotters) are not restricted to just using pens, but can be used with all sorts of custom drawing tools, some of which (like paint brushes) require regular "refills" every N strokes/dots. For that reason, some shape types (currently only shape groups and point clouds) are supporting config & behavior options for interleaving their normal shape command sequence with additional tool-specific arbitrary utility command sequences (e.g. to regularly dip a brush into a paint pot/palette).
import { AxiDraw, COMMENT, dip, MOVE } from "@thi.ng/axidraw";
import { circle, points, vertices } from "@thi.ng/geom";
import { asAxiDraw } from "@thi.ng/geom-axidraw";

(async () => {
    // create point cloud container
    const pts = points(
        // using 24 points on a circle w/ origin @ 150,150, radius=100
        vertices(circle([150, 150], 100), 24),
        { __axi: {
            // use command interleaving
            interleave: {
                // every 5 points/dots
                num: 5,
                // insert these draw commands:
                // (this function is being re-called every `num` points and
                // can produce different commands to insert each time...)
                commands: (n) => [
                    // no-op command, but will be logged during plotting
                    COMMENT(`--- refill brush (@ ${n} points) ---`),
                    // move to XY pos (i.e. position of paint reservoir)
                    MOVE([10,50]),
                    // dip the brush 3x times down & up (each time wait 200ms whilst down)
                    // (dip() creates a cmd sequence, so need to use the spread operator `...` here)
                    ...dip(3, { downDelay: 200 }),
                    // (...and then drawing continues w/ next 5 points)
                ]
            }
        }
    });

    // actually connect & send to plotter
    const axi = new AxiDraw();
    await axi.connect();
    await axi.draw(asAxiDraw(pts));
})();ALPHA - bleeding edge / work-in-progress
Search or submit any issues for this package
- @thi.ng/axidraw - Minimal AxiDraw plotter/drawing machine controller for Node.js
yarn add @thi.ng/geom-axidrawESM import:
import * as gaxi from "@thi.ng/geom-axidraw";Browser ESM import:
<script type="module" src="https://esm.run/@thi.ng/geom-axidraw"></script>For Node.js REPL:
const gaxi = await import("@thi.ng/geom-axidraw");Package sizes (brotli'd, pre-treeshake): ESM: 1.49 KB
- @thi.ng/api
- @thi.ng/arrays
- @thi.ng/axidraw
- @thi.ng/compare
- @thi.ng/defmulti
- @thi.ng/geom
- @thi.ng/geom-accel
- @thi.ng/geom-api
- @thi.ng/geom-clip-line
- @thi.ng/geom-isec
- @thi.ng/transducers
- @thi.ng/vectors
TODO
If this project contributes to an academic publication, please cite it as:
@misc{thing-geom-axidraw,
  title = "@thi.ng/geom-axidraw",
  author = "Karsten Schmidt",
  note = "https://thi.ng/geom-axidraw",
  year = 2022
}© 2022 - 2024 Karsten Schmidt // Apache License 2.0