[!NOTE] This is one of 199 standalone projects, maintained as part of the @thi.ng/umbrella monorepo and anti-framework.
🚀 Please help me to work full-time on these projects by sponsoring me on GitHub. Thank you! ❤️
Benchmarking & profiling utilities w/ various statistics & formatters (CSV, JSON, Markdown etc.).
Though no public API change (only additions), since v2.0.0 this library
internally (via
now()) attempts to
use high-res ES
BigInt
timestamps (in Node via
process.hrtime.bigint())
or falls back to performance.now() or lacking that to Date.now(). In all
cases, returns a (possibly rounded) nanosec-scale timestamp, either as bigint
or number. The
timeDiff()
function can be used to compute the difference between two such timestamp and
return it as milliseconds.
STABLE - used in production
Search or submit any issues for this package
- @thi.ng/csv - Customizable, transducer-based CSV parser/object mapper and transformer
- @thi.ng/markdown-table - Markdown table formatter/generator with support for column alignments
yarn add @thi.ng/benchESM import:
import * as bench from "@thi.ng/bench";Browser ESM import:
<script type="module" src="https://esm.run/@thi.ng/bench"></script>For Node.js REPL:
const bench = await import("@thi.ng/bench");Package sizes (brotli'd, pre-treeshake): ESM: 2.14 KB
Note: @thi.ng/api is in most cases a type-only import (not used at runtime)
10 projects in this repo's /examples directory are using this package:
| Screenshot | Description | Live demo | Source |
|---|---|---|---|
 |
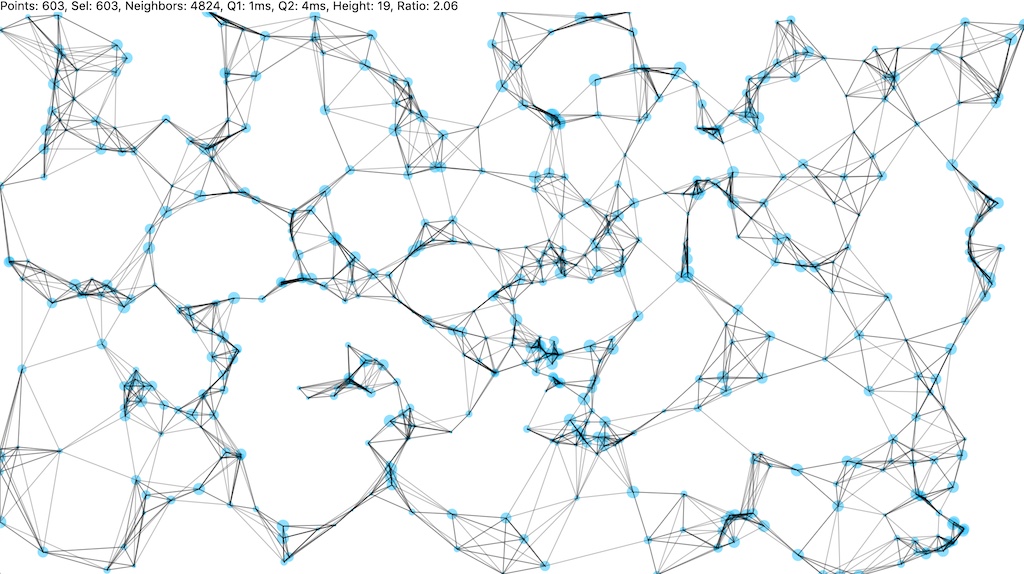
Doodle w/ K-nearest neighbor search result visualization | Demo | Source |
 |
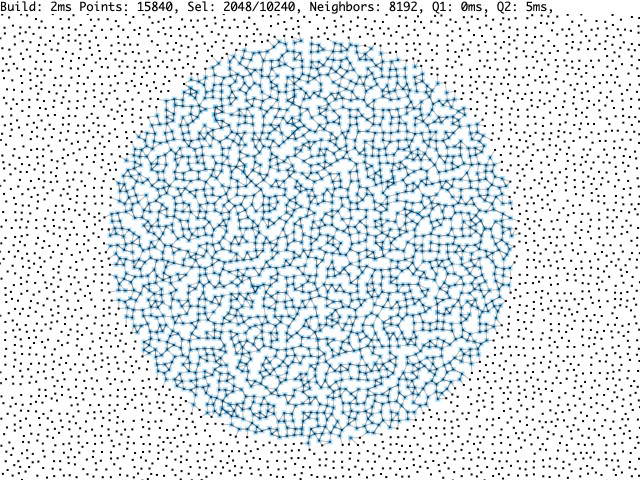
K-nearest neighbor search in an hash grid | Demo | Source |
 |
Poisson-disk shape-aware sampling, Voronoi & Minimum Spanning Tree visualization | Demo | Source |
| GPU-based data reduction using thi.ng/shader-ast & WebGL multi-pass pipeline | Demo | Source | |
 |
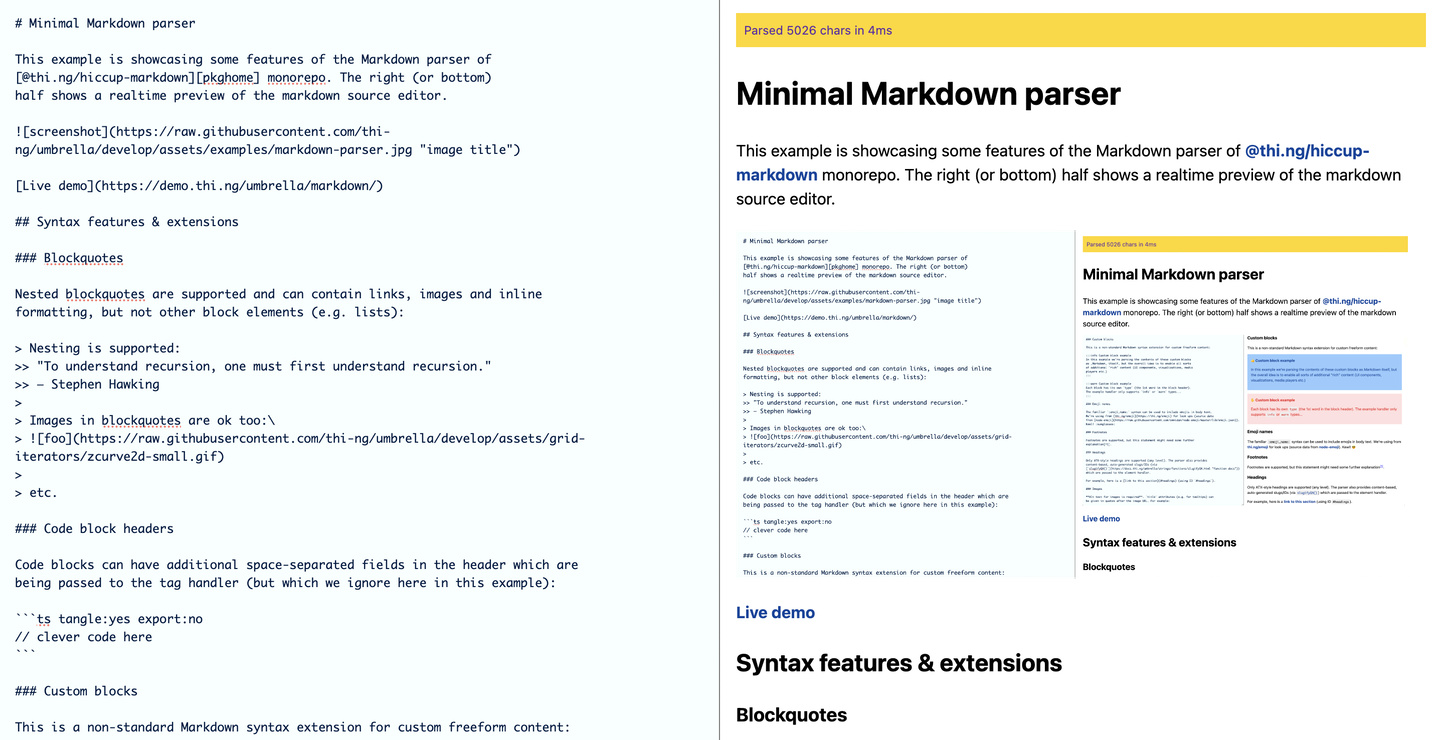
Markdown to Hiccup to HTML parser / transformer | Demo | Source |
 |
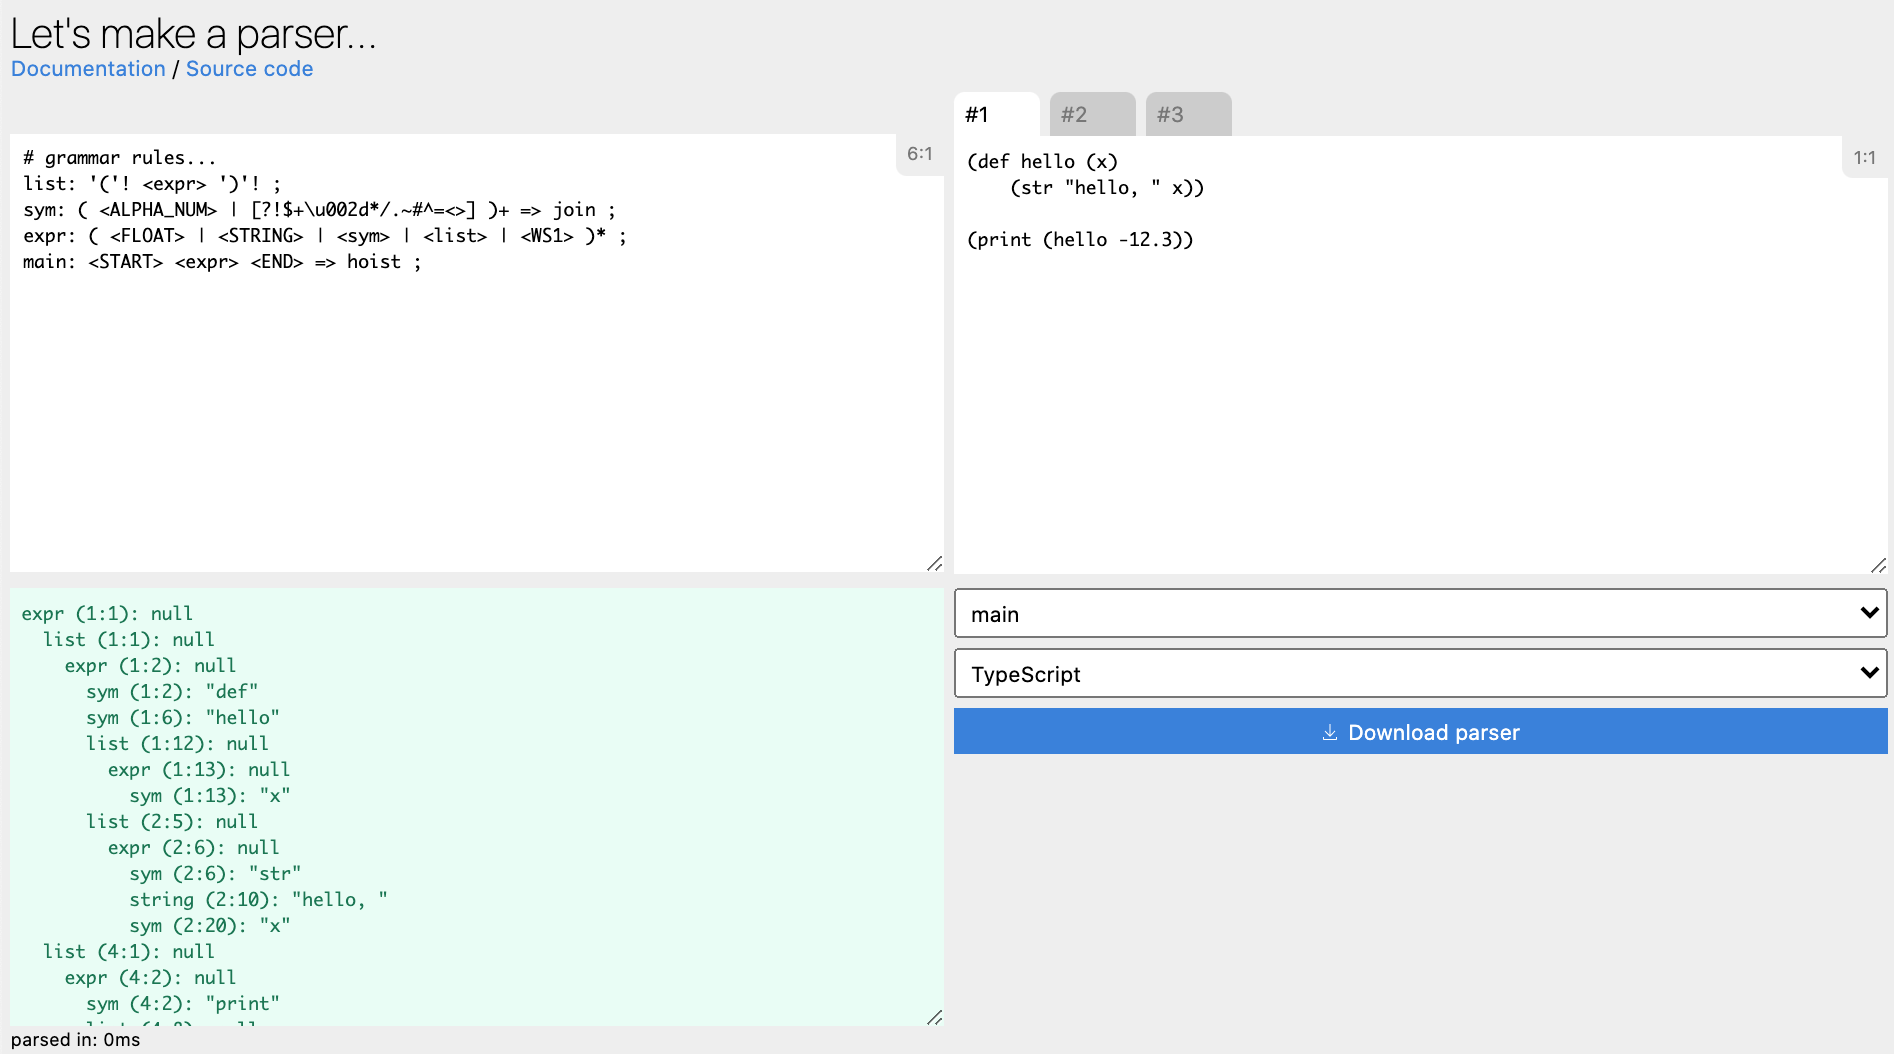
Parser grammar livecoding editor/playground & codegen | Demo | Source |
| Interactive pixel sorting tool using thi.ng/color & thi.ng/pixel | Demo | Source | |
 |
Image-based Poisson-disk sampling | Demo | Source |
| Full umbrella repo doc string search w/ paginated results | Demo | Source | |
 |
Fork-join worker-based raymarch renderer (JS/CPU only) | Demo | Source |
// functions to benchmark...
const fib = (n: number) =>
    n > 2
        ? fib(n - 1) + fib(n - 2)
        : n > 0
            ? 1
            : 0;

const fib2 = (n: number) => {
    const res = [0, 1];
    for(let i = 2; i <= n; i++) {
        res[i] = res[i - 1] + res[i - 2];
    }
    return res[n];
};
import { timed, bench } from "@thi.ng/bench";
<<test-functions>>
// measure single execution time
console.log(timed(() => fib(40)));
// 318.86ms
// 102334155
console.log(timed(() => fib2(40)));
// 0.05ms
// 102334155
// measure 1mil iterations (default)
console.log(bench(() => fib(10), 1e6));
// 157.41ms
// 55
console.log(bench(() => fib2(10), 1e6));
// 95.97ms
// 55The benchmark() function executes a number of warmup runs, before
executing the main measurement and producing a number of useful
statistics: mean, median, min/max, 1st/3rd quartile, standard deviation
(as percentage)...
See api.ts for configuration options.
Also see the formatting section below for other output options. This example uses the default format...
import { benchmark } from "@thi.ng/bench";

<<test-functions>>

benchmark(() => fib(40), { title: "fib", iter: 10, warmup: 5 });
// benchmarking: fib
//         warmup... 1480.79ms (5 runs)
//         total: 2917.41ms, runs: 10 (@ 1 calls/iter)
//         freq: 3.43 ops/sec
//         mean: 291.74ms, median: 291.67ms, range: [291.51..292.58]
//         q1: 291.55ms, q3: 291.79ms
//         sd: 0.10%

// also returns results:
// {
//   title: "fib",
//   iter: 10,
//   size: 1,
//   total: 2917.4060010000003,
//   freq: 3.4277025537660157,
//   mean: 291.74060010000005,
//   median: 291.668125,
//   min: 291.50624999999997,
//   max: 292.581834,
//   q1: 291.55116699999996,
//   q3: 291.788417,
//   sd: 0.10295312107365955,
// }Multiple benchmarks can be run sequentially as suite (also returns an array of all results):
import { suite, FORMAT_MD } from "@thi.ng/bench";

<<test-functions>>

suite(
    [
        { title: "fib2(10)", fn: () => fib2(10) },
        { title: "fib2(20)", fn: () => fib2(20) },
        { title: "fib2(30)", fn: () => fib2(30) },
        { title: "fib2(40)", fn: () => fib2(40) },
    ],
    { iter: 10, size: 100000, warmup: 5, format: FORMAT_MD }
)

// |                   Title|    Iter|    Size|       Total|   Frequency|    Mean|  Median|     Min|     Max|      Q1|      Q3|     SD%|
// |------------------------|-------:|-------:|-----------:|-----------:|-------:|-------:|-------:|-------:|-------:|-------:|-------:|
// |                fib2(10)|      10|  100000|       93.25| 10723774.45|    9.33|    9.25|    8.94|   10.27|    9.03|    9.46|    4.15|
// |                fib2(20)|      10|  100000|      110.73|  9030823.33|   11.07|   11.02|   10.91|   11.56|   10.92|   11.10|    1.76|
// |                fib2(30)|      10|  100000|      175.10|  5711056.26|   17.51|   17.58|   17.03|   17.65|   17.50|   17.60|    0.96|
// |                fib2(40)|      10|  100000|      200.01|  4999765.64|   20.00|   19.71|   19.34|   21.78|   19.55|   19.91|    3.90|
Same table as actual Markdown:
| Title | Iter | Size | Total | Frequency | Mean | Median | Min | Max | Q1 | Q3 | SD% |
|---|---|---|---|---|---|---|---|---|---|---|---|
| fib2(10) | 10 | 100000 | 93.25 | 10723774.45 | 9.33 | 9.25 | 8.94 | 10.27 | 9.03 | 9.46 | 4.15 |
| fib2(20) | 10 | 100000 | 110.73 | 9030823.33 | 11.07 | 11.02 | 10.91 | 11.56 | 10.92 | 11.10 | 1.76 |
| fib2(30) | 10 | 100000 | 175.10 | 5711056.26 | 17.51 | 17.58 | 17.03 | 17.65 | 17.50 | 17.60 | 0.96 |
| fib2(40) | 10 | 100000 | 200.01 | 4999765.64 | 20.00 | 19.71 | 19.34 | 21.78 | 19.55 | 19.91 | 3.90 |
The following output formatters are available. Custom formatters can be easily
defined (see source for examples). Formatters are configured via the format
option given to benchmark() or suite().
-
FORMAT_DEFAULT- default plain text formatting -
FORMAT_CSV- Comma-separated values (w/ column header) -
FORMAT_MD- Markdown table format
Since v3.3.0 the package also provides a basic profiler to take named measurements and compute derived statistics. The profiler can by dynamically enabled/disabled, supports recursion and estimates/subtracts its internal overhead. Results can be obtained as JSON objects or CSV.
import { Profiler } from "@thi.ng/bench";

// initialize with 1million warmup iterations to compute internal overhead (takes around ~100ms)
const profiler = new Profiler({ warmup: 1e6 });

// recursive function
const countdown = (n, acc = []) => {
    profiler.start("countdown");
    if (n > 0) countdown(n - 1, (acc.push(n),acc));
    profiler.end("countdown");
    return acc;
}

countdown(10);
// [ 10, 9, 8, 7, 6, 5, 4, 3, 2, 1 ]

countdown(5);
// [ 5, 4, 3, 2, 1 ]

// obtain results
profiler.deref()
// {
//   countdown: {
//     id: 'countdown',
//     total: 0.028939979283999998,
//     timePerCall: 0.0017023517225882353,
//     totalPercent: 95.99309794988116,
//     calls: 17,
//     callsPercent: 100,
//     maxDepth: 11
//   }
// }

// results formatted as CSV
console.log(profiler.asCSV())
// "id","total (ms)","time/call (ms)","total (%)","calls","calls (%)","max depth"
// "countdown",0.0289,0.0017,17,95.99,100.00,11- Karsten Schmidt
If this project contributes to an academic publication, please cite it as:
@misc{thing-bench,
  title = "@thi.ng/bench",
  author = "Karsten Schmidt",
  note = "https://thi.ng/bench",
  year = 2018
}© 2018 - 2024 Karsten Schmidt // Apache License 2.0


