This library provides deeply integrated protocol-agnostic Nestjs OpenTelemetry instrumentations, metrics and SDK.
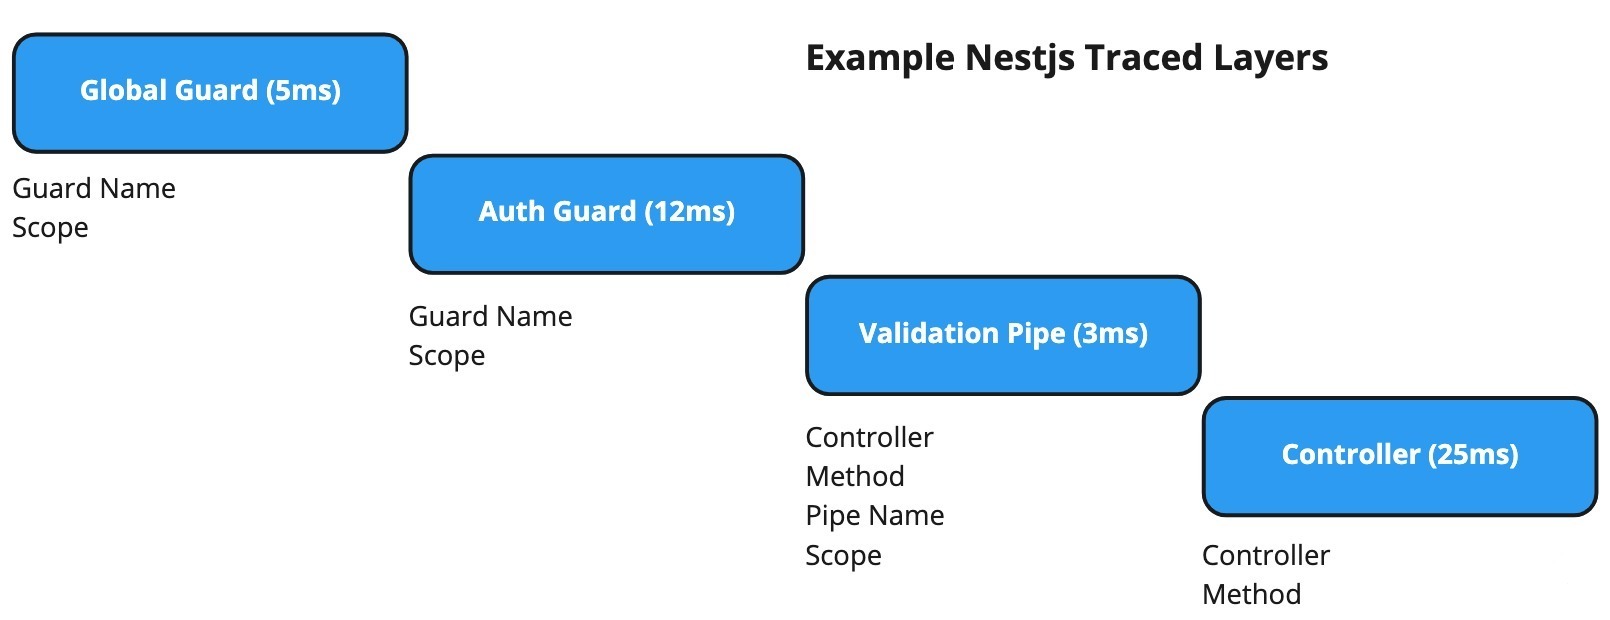
Nestjs is a protocol-agnostic framework. That's why this library can able to work with different protocols like RabbitMQ, GRPC and HTTP. Also you can observe and trace Nestjs specific layers like Pipe, Guard, Controller and Provider.
It also includes auto trace and metric instrumentations for some popular Nestjs libraries.
Supports NestJS 9.x and 10.x
npm install @n0isy/nestjs-open-telemetry --saveThis is a basic configuration without any trace and metric exporter, but includes default metrics and injectors
import { OpenTelemetryModule } from '@n0isy/nestjs-open-telemetry'

@Module({
  imports: [
    OpenTelemetryModule.forRoot({
      serviceName: 'nestjs-opentelemetry-example',
      metrics: {
        enabled: true,         // Enable metrics collection
        controller: true,      // Enable metrics endpoint (/metrics by default)
        endpoint: '/metrics',  // Customize metrics endpoint path
        prefix: 'app_',        // Add prefix to all metrics
      }
    })
  ]
})
export class AppModule {}
Async configuration example (Not recommended, May cause auto instrumentations to not work)
import { OpenTelemetryModule } from '@n0isy/nestjs-open-telemetry'
import { ConfigModule, ConfigService } from '@nestjs/config'

@Module({
  imports: [
    OpenTelemetryModule.forRootAsync({
      imports: [ConfigModule],
      useFactory: async (configService: ConfigService) => ({
        serviceName: configService.get('SERVICE_NAME'),
      }),
      inject: [ConfigService]
    })
  ]
})
export class AppModule {}| key | value | description |
|---|---|---|
| autoInjectors | DecoratorInjector, ScheduleInjector, ControllerInjector, GuardInjector, PipeInjector, InterceptorInjector, ExceptionFilterInjector, TypeormInjector, LoggerInjector, ProviderInjector, MiddlewareInjector | default auto trace instrumentations |
| contextManager | AsyncLocalStorageContextManager | default trace context manager inherited from NodeSDKConfiguration |
| instrumentations | AutoInstrumentations | default instrumentations inherited from NodeSDKConfiguration |
| textMapPropagator | W3CTraceContextPropagator | default textMapPropagator inherited from NodeSDKConfiguration |
OpenTelemetryModule.forRoot() takes OpenTelemetryModuleConfig as a parameter, this type is inherited by NodeSDKConfiguration so you can use same OpenTelemetry SDK parameter.
Simple setup with Zipkin exporter, including with default trace instrumentations.
import { OpenTelemetryModule } from '@n0isy/nestjs-open-telemetry'
import { OTLPTraceExporter } from '@opentelemetry/exporter-trace-otlp-grpc'
import { SimpleSpanProcessor } from '@opentelemetry/sdk-trace-base'

@Module({
  imports: [
    OpenTelemetryModule.forRoot({
      spanProcessors: [
        new SimpleSpanProcessor(
          new OTLPTraceExporter({
            url: 'http://<collector-hostname>:<port>',
          })
        ),
      ],
    }),
  ],
})
export class AppModule {}
After setup, your application will be instrumented, so that you can see almost every layer of application in ZipkinUI, including Guards, Pipes, Controllers even global layers like this
List of supported official exporters here.
This library supports auto instrumentations for Nestjs layers, but sometimes you need to define custom span for specific method blocks like providers methods. In this case @Trace and @TracePlain decorator will help you.
import { Injectable } from '@nestjs/common'
import { Trace } from '@n0isy/nestjs-open-telemetry'

@Injectable()
export class AppService {
  @Trace()
  getHello(): string {
    return 'Hello World!'
  }
}
Also @Trace decorator takes name field as a parameter
@Trace({ name: 'hello' })In an advanced usage case, you need to access the native OpenTelemetry Trace provider to access them from Nestjs application context.
import { Injectable } from '@nestjs/common'
import { Tracer } from '@opentelemetry/sdk-trace-base'

@Injectable()
export class AppService {
  constructor() {}

  getHello(): string {
    const span = trace.getTracer('default').startSpan('important_section_start')
    // do something important
    span.setAttributes({ userId: 1150 })
    span.end()
    return 'Hello World!'
  }
}The most helpful part of this library is that you already get all of the instrumentations by default if you set up a module without any extra configuration. If you need to avoid some of them, you can use the autoInjectors parameter.
import { Module } from '@nestjs/common'
import {
  ControllerInjector,
  EventEmitterInjector,
  GuardInjector,
  LoggerInjector,
  OpenTelemetryModule,
  PipeInjector,
  ProviderInjector,
  ScheduleInjector,
} from '@n0isy/nestjs-open-telemetry'
import { OTLPTraceExporter } from '@opentelemetry/exporter-trace-otlp-grpc'
import { SimpleSpanProcessor } from '@opentelemetry/sdk-trace-base'

@Module({
  imports: [
    OpenTelemetryModule.forRoot({
      // Specify which injectors to use
      autoInjectors: [
        ControllerInjector,
        GuardInjector,
        EventEmitterInjector,
        ScheduleInjector,
        PipeInjector,
        LoggerInjector,
        ProviderInjector,
      ],
      // Configure specific injectors
      injectorsConfig: {
        // Exclude certain providers from tracing
        ProviderInjector: {
          excludeProviders: [
            "ConfigService",
            "Logger",
            "OpenTelemetryService",
            "PinoLogger",
            "DatabaseProvider",
            "JwtService",
          ],
        },
      },
      spanProcessors: [
        new SimpleSpanProcessor(
          new OTLPTraceExporter({
            url: 'http://<collector-hostname>:<port>',
          })
        ),
      ],
    }),
  ]
})
export class AppModule {}| Instance | Description |
|---|---|
ControllerInjector |
Auto trace all of module controllers |
DecoratorInjector |
Auto trace all of decorator providers |
GuardInjector |
Auto trace all of module guards including global guards |
PipeInjector |
Auto trace all of module pipes including global pipes |
InterceptorInjector |
Auto trace all of module interceptors including global interceptors |
ExceptionFilterInjector |
Auto trace all of module exceptionFilters including global exceptionFilters |
MiddlewareInjector |
Auto trace all of module middlewares including global middlewares |
ProviderInjector |
Auto trace all of module providers |
ScheduleInjector |
Auto trace for @nestjs/schedule library, supports all features |
LoggerInjector |
Logger class tracer |
TypeormInjector |
Auto trace for typeorm library |
MetricInjector |
Auto inject metrics for decorated methods (new in 1.3.0) |
OpenTelemetry Metrics are now fully supported (as of v1.3.0). The module provides a comprehensive metrics solution that works with both Express and Fastify backends.
import { OpenTelemetryModule } from '@n0isy/nestjs-open-telemetry'
import { PrometheusExporter } from '@opentelemetry/exporter-prometheus'

@Module({
  imports: [
    OpenTelemetryModule.forRoot({
      serviceName: 'my-service',
      metrics: {
        enabled: true,                // Enable metrics collection
        controller: true,             // Enable /metrics endpoint
        endpoint: '/metrics',         // Custom endpoint path (default is /metrics)
        prefix: 'app_',               // Prefix for all metrics
        defaultLabels: {              // Default labels for all metrics
          environment: 'production',
        },
        // Optional authentication function
        authentication: (req) => {
          return req.headers['x-api-key'] === 'secret-key'
        },
      }
    })
  ]
})
export class AppModule {}
The metrics are exposed in Prometheus format at the /metrics endpoint (or custom path). The PrometheusExporter from OpenTelemetry is used for formatting but without starting a separate HTTP server.
The library provides several decorators for metrics:
import { Injectable } from '@nestjs/common'
import { Counter, Histogram, UpDownCounter, ObservableGauge } from '@n0isy/nestjs-open-telemetry'

@Injectable()
export class UserService {
  private activeUsers = 0;

  // Count method calls
  @Counter({
    name: 'user_login_total',
    description: 'Total number of user logins',
    attributes: { service: 'user-service' },
  })
  login(userId: string): void {
    // Method will be counted on each call
    this.activeUsers++;
    // Implementation...
  }

  // Measure duration of method execution
  @Histogram({
    name: 'user_search_duration_ms',
    description: 'Search operation duration in milliseconds',
    unit: 'ms',
  })
  async searchUsers(query: string): Promise<User[]> {
    // Method duration will be automatically measured
    const result = await this.userRepository.search(query);
    return result;
  }

  // Track values that go up and down
  @UpDownCounter({
    name: 'active_users',
    description: 'Number of currently active users',
    attributes: { region: 'us-east' },
  })
  userSessionChange(delta: number): void {
    // The delta value will be added to the counter
    this.activeUsers += delta;
    // Implementation...
  }

  // Observe current values
  @ObservableGauge({
    name: 'memory_usage_bytes',
    description: 'Current memory usage in bytes',
    unit: 'bytes',
  })
  getMemoryUsage(): number {
    // Return value will be recorded as a gauge metric
    return process.memoryUsage().heapUsed;
  }
}The module automatically collects HTTP metrics using a universal middleware that works with both Express and Fastify. These metrics include:
- Request counts by route, method, and status code
- Request duration in milliseconds
- Request and response sizes in bytes
You can also create custom metrics directly using the OpenTelemetryService:
import { Injectable } from '@nestjs/common'
import { OpenTelemetryService } from '@n0isy/nestjs-open-telemetry'

@Injectable()
export class CustomMetricsService {
  // Counters
  private readonly requestCounter;
  // Histograms
  private readonly requestDurationHistogram;

  constructor(private readonly openTelemetryService: OpenTelemetryService) {
    // Create metrics
    this.requestCounter = this.openTelemetryService.createCounter(
      'custom_requests_total',
      { description: 'Total custom requests' }
    );

    this.requestDurationHistogram = this.openTelemetryService.createHistogram(
      'custom_request_duration_ms',
      { description: 'Request duration in ms', unit: 'ms' }
    );
  }

  trackRequest(path: string, status: number, duration: number): void {
    const attributes = {
      path,
      status: status.toString()
    };

    // Increment counter with attributes
    this.requestCounter.add(1, attributes);

    // Record duration in histogram
    this.requestDurationHistogram.record(duration, attributes);
  }
}
To view metrics, access the /metrics endpoint of your application. The metrics are provided in Prometheus format and can be scraped by Prometheus server or any compatible monitoring system.


