
@image-tracer-ts/core
Trace images into SVG.
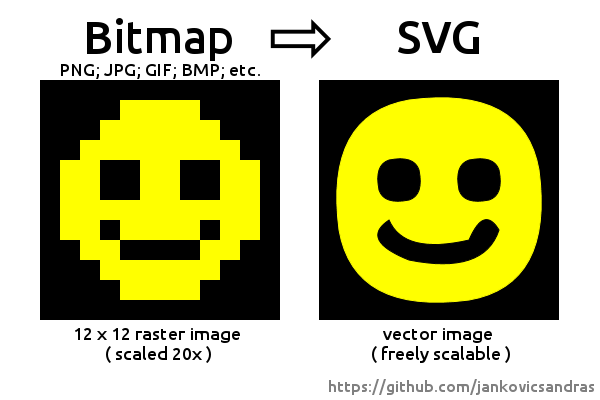
Typescript reimplementation of imagetracer-js.
Provides ESM and CJS packages.
The core package only works with ImageData, use @image-tracer-ts/browser or @image-tracer-ts/nodejs to trace different image formats (like PNG, JPEG, etc) from different sources (files, buffers, URLs, etc).
Basic Usage
import { ImageTracer, Options } from '@image-tracer/core';
const options: Partial<Options> = {fillStyle: 'stroke'}
const tracer = new ImageTracer(options)
const svgString = tracer.traceImage(imageData, drawer)
Options
Tracing happens in four steps, each comes with several configuration options. Pass them in a configuration object, or as command line parameter, prefixed with -- (i.e. --blurRadius 5).
Step 1: Image preprocessing
Optional steps to adjust image before processing.
| Option | Type | Default | Description |
|---|---|---|---|
| blurRadius | number (between 0 and 5) |
0 (off) |
Number of pixels (in each direction) to calculate the blurred pixel value from. |
| blurDelta | number (0 - 4*255) | 20 |
Maximum allowed difference between original pixel and blurred pixel when summing up RGBA values. If a blurred pixel exceeds delta, the original pixel is used instead. |
| sharpen | boolean | false |
Use sharpen filter |
| sharpenThreshold | number (0 - 4*255) | 20 |
Maximum allowed difference between original pixel and sharpened pixel when summing up RGBA values. If a sharpened pixel exceeds threshold, the original pixel is used instead. |
Step 2: Building a color index
Create a base palette and apply clustering to the pixels in the image to build color layer masks.
| Option | Type | Default | Description |
|---|---|---|---|
| colorSamplingMode |
generate | sample | scan | palette
|
scan |
Select how internal palette will be generated:
|
| palette | Array<{r:number, g:number, b:number, a?:number}> |
null |
Array of colors to use with colorSamplingMode=palette
|
| numberOfColors | number | 16 |
Number of colors to be generated. |
| colorClusteringCycles | number | 3 |
Number of color clustering cycles. |
| colorDistanceBuffering |
off | on | reasonable
|
reasonable |
Buffers color distances during clustering. Very efficient if palette has more than 30 colors. |
| minColorQuota | number (between 0 and 1) |
0 (off) |
Threshold for color pruning during color clustering. If ratio between pixels of a color and all pixels is below the given number, the color will be replaced by a random color. |
Step 3: Tracing
Create vector data from pixels.
| Option | Type | Default | Description |
|---|---|---|---|
| minShapeOutline | number |
0 (off) |
Discard traced areas with an outline of less than the given number of points. |
| interpolation |
off | interpolate
|
interpolate |
Sets interpolation mode. |
| enhanceRightAngles | boolean | true |
Do not interpolate right angles. |
| lineErrorMargin | number | 1 |
Line tracer error margin. Gives the squared maximum distance a point can be off a line trajectory to be still put on it. |
| curveErrorMargin | number | 1 |
Curve tracer error margin. Gives the squared maximum distance a point can be off a curved trajectory to be put on it. |
Step 4: Drawing
Create SVG data from vectors.
| Option | Type | Default | Description |
|---|---|---|---|
| fillStyle |
fill | stroke | stroke+fill
|
stroke+fill |
Select how color segments are colored. |
| strokeWidth | number | 1 |
Stroke width written to SVG path. |
| scale | number | 1 |
Multiply all coordinates by this number. |
| decimalPlaces | number | 1 |
Number of decimal places in svg values. |
| viewBox | boolean | true |
If enabled, the viewBox attribute will be set on the SVG tag element. |
| trim |
off | ratio | all
|
off |
Removes empty border from the image. |
| lineFilter | boolean | false |
Do not draw lines (areas with less than 3 points). |
| desc | boolean | false |
Write a desc attribute to SVG edges with debug output |
| segmentEndpointRadius | number |
0 (off) |
Enables control output, draws white dots with given radius at segment borders. |
| curveControlPointRadius | number |
0 (off) |
Enables control output, draws curve control points as cyan dots with given radius. |
Misc
| Option | Type | Default | Description |
|---|---|---|---|
| verbose | boolean | false |
Write status data to console during trace. |
| out | string | input file name + .svg
|
Set output file name (in ImageTracerNodejs) |
| preset | see preset names below | null | Use preset from command line |
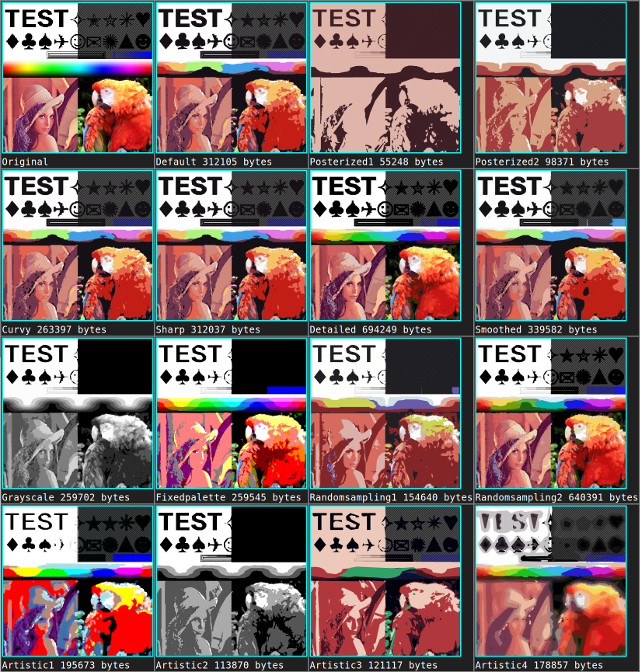
Named presets
Preset configurations can be imported from the Options object:
import { Options } from '@image-tracer/core';
ImageTracerBrowser.fromUrl<OutputType = string>(url, Options.Presets.posterized1)
From command line, the --preset parameter can be used along with a preset name:
default-
posterized1posterized2posterized3 curvysharpdetailedsmoothedgrayscalefixedpalette-
randomsampling1randomsampling2 -
artistic1artistic2artistic3artistic4
Overriding the SVG Generator
You can provide a custom ImageDrawer to change how output is created from traced data:
const drawer = new CustomizedImageDrawer()
const svgString = new ImageTracer(options).traceImage(imageData, drawer)