This project is now in Vue 3 only.
If using vue 2, use the Vue-2 branch
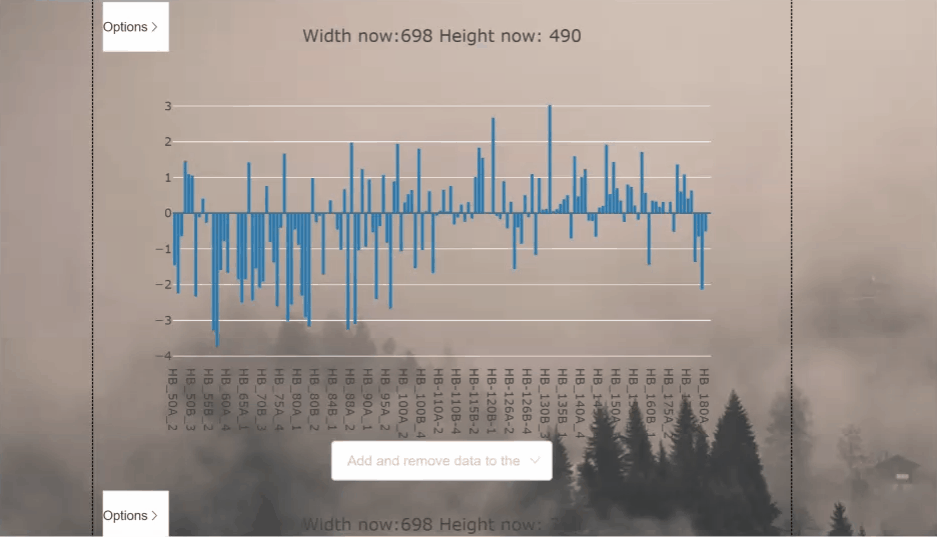
This project aims to process and display csv files as graphs in the vue framework
Demo the site functionality of this app here*.
*Demo will take 30s to load while Heroku server boots
Don't feel like coding? See how to copy and paste plotvuer as an HTML widget here
npm i @abi-software/plotvuer
npm install
npm run serve
npm run build-bundle
Include the package in your script.
import { PlotVuer } from '@abi-software/plotvuer'
import '@abi-software/plotvuer/dist/plotvuer.css'
Local registration in vue component:
export default {
  ...
  components: {
    PlotVuer,
  }
  ...
}
The snippet above registers the Plotvuer component into the global scope. You can now use the Plotvuer in your vue template as followed:
<PlotVuer :data-source="data" :metadata="metadata" :supplemental-data="supplementalData"></PlotVuer>datasource has two options for loading data into plotvuer:
let data = {
  data: [
    {
      x: [0, 1, 2, 3, 4, 5],
      y: [100, 10, 130, 70, 80, 90],
      type: 'scatter'
    }
  ],
  layout: { // **Optional**
    height: '700px',
    margin: {
      t: 35,
      l: 85,
      r: 55,
      b: 190,
      pad: 4
    }
  }
}


let metadata = {
  version: '1.1.0',
  type: 'plot',
  attrs: {
    style: 'timeseries', // Style will be 'timeseries' or 'heatmap'
    }
  }
}
Note that these are the same inputs for data and layout as plotly normally takes in Plotly.newPlot()
let data = {
  url : 'https://example.com/myfile.csv'
}


let metadata= {
  version: '1.1.0',
  type: 'plot',
  attrs: {
    'x-axis-column': 2, // **Optional**
    style: 'timeseries',
    'y-axes-columns': [3, 4, 5, 6, 7, 8, 9, 10], // **Optional**
    'plot-layout': { // **Optional**
      height: '700px',
      margin: {
        t: 35,
        l: 85,
        r: 55,
        b: 190,
        pad: 4
      }
    }
  }
}

let supplementalData = {
  url : 'https://example.com/mySupplementalFile.json'
}plotvuer will load and csv file that follow the form of headers on first row and coloumn and if data is time based, rows will be assumed to be time dependant.
| Gene 1 | Gene 2 | |
|---|---|---|
| Sample 1 | -1.54 | -3.40 |
| Sample 2 | 0.68 | 1.22 |
| Sample 3 | 0.05 | 0.66 |
| time (seconds) | Sweep 0_Membrane Potential (mV) |
|---|---|
| 0 | -70.12939453 |
| 0.0002 | -70.12939453 |
| 0.0004 | -70.34301758 |
Paste the following lines in the <body> of you HTML
 <!-- Modify the 'file' input to point to a csv file you wish to show -->
 <plot-vuer-widget file="https://mapcore-bucket1.s3-us-west-2.amazonaws.com/ISAN/csv-data/use-case-4/RNA_Seq.csv"></plot-vuer-widget>
 <!-- widget source css from cdn-->
 <link href="https://cdn.jsdelivr.net/npm/@tehsurfer/plotvuer-widget/dist/plotVuer.css" rel="stylesheet">
 <!-- widget source js from cdn -->
<script src="https://cdn.jsdelivr.net/npm/@tehsurfer/plotvuer-widget/dist/plotVuer.js"></script>Change this line to point at a csv file for display
 <!-- Modify the 'file' input to point to a csv file you wish to show -->
<plot-vuer-widget file="./path/to/file.csv"></plot-vuer-widget>The documentation is developed with vitepress and vuese. Documentation pages are in the docs folder.
npm run docs:watchThis will start the documentation server with vitepress on port :5173 and watch the components' changes.