
x-plot 


A Web Component that plots zoomable and pannable waveforms.
npm i x-plot
|
pnpm add x-plot
|
yarn add x-plot
|
Examples
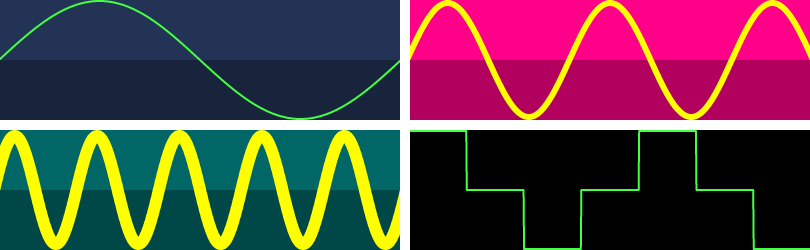
# multiple
Try it live
# view source
example/multiple.ts
import { PlotElement } from 'x-plot'
customElements.define('x-plot', PlotElement)

document.body.innerHTML = /*html*/ `
<div id="demo" style="display:inline-grid;grid:1fr 1fr/1fr 1fr;gap:5px;">
  <x-plot width="200" height="60"></x-plot>
  <x-plot width="200" height="60" background="#f08" color="#ff0" zoom="4" linewidth="3"></x-plot>
  <x-plot width="200" height="60" background="#066" color="yellow" zoom="20" linewidth="6"></x-plot>
  <x-plot width="200" height="60" background="#000"></x-plot>
</div>
`

const plots = document.querySelectorAll('x-plot') as NodeListOf<PlotElement>
const rate = 44100
const sine = (i: number, hz: number) =>
  Math.sin(hz * (i * (1 / rate)) * Math.PI * 2)

plots[0].data = Array(44100).fill(0).map((_, i) => sine(i, 1))
plots[1].data = Array(44100).fill(0).map((_, i) => sine(i, 10))
plots[2].data = Array(44100).fill(0).map((_, i) => sine(i, 100))
plots[3].data = [1, 0, -1, 0, 1, 0, -1]
# web
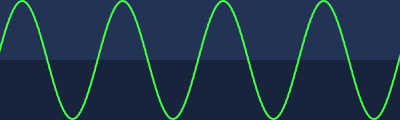
Try it live
# view source
example/web.ts
import { PlotElement } from 'x-plot'
customElements.define('x-plot', PlotElement)

const plot = new PlotElement()
plot.id = 'demo'

document.body.appendChild(plot)

let n = 0
const sine = (i: number, hz: number) =>
  Math.sin(hz * (i * (1 / 1000)) * Math.PI * 2)
const loop = () => {
  requestAnimationFrame(loop)
  plot.data = Array(1000).fill(0).map(_ => sine(++n, 4))
  n += 1000 / 4 / 60 // sampleRate/hz/frameRate to loop video capture every 1 second
}
loop()
API
Context<PlotElement & JsxContext<PlotElement> & Omit<{ <T>(ctor) => <T>(ctx) => #
src/x-plot.ts#L30 PlotElement – Plot.
#
src/work/stagas/sigl/dist/types/sigl.d.ts#L25 $
CleanClass<T>
Wrapper<T>
},
"transition">> # context
src/work/stagas/sigl/dist/types/sigl.d.ts#L26 ContextClass<PlotElement & JsxContext<PlotElement> & Omit<{
<T>(ctor) =>
-
CleanClass<T>
<T>(ctx) =>
-
Wrapper<T>
},
"transition">> # data – Array-like number data to plot, range -1..+1, 0=center, -1=bottom, +1=top.
src/x-plot.ts#L47 ArrayLike<number>
# onmounted
EventHandler<PlotElement, CustomEvent<any>>
# onunmounted
EventHandler<PlotElement, CustomEvent<any>>
# created(ctx)
Context<PlotElement & JsxContext<PlotElement> & Omit<{ <T>(ctor) => #
ctx
CleanClass<T>
<T>(ctx) =>
-
Wrapper<T>
},
"transition">> created(ctx) =>
- void
# mounted($)
src/x-plot.ts#L64 Context<PlotElement & JsxContext<PlotElement> & Omit<{ <T>(ctor) => #
$
CleanClass<T>
<T>(ctx) =>
-
Wrapper<T>
},
"transition">> mounted($) =>
- void
# on(name)
on<K>(name) =>
-
On<Fn<[ EventHandler<PlotElement, LifecycleEvents & object [K]> ], Off>>
# toJSON()
toJSON() =>
-
Pick<PlotElement, keyof PlotElement>
Credits
Contributing
All contributions are welcome!