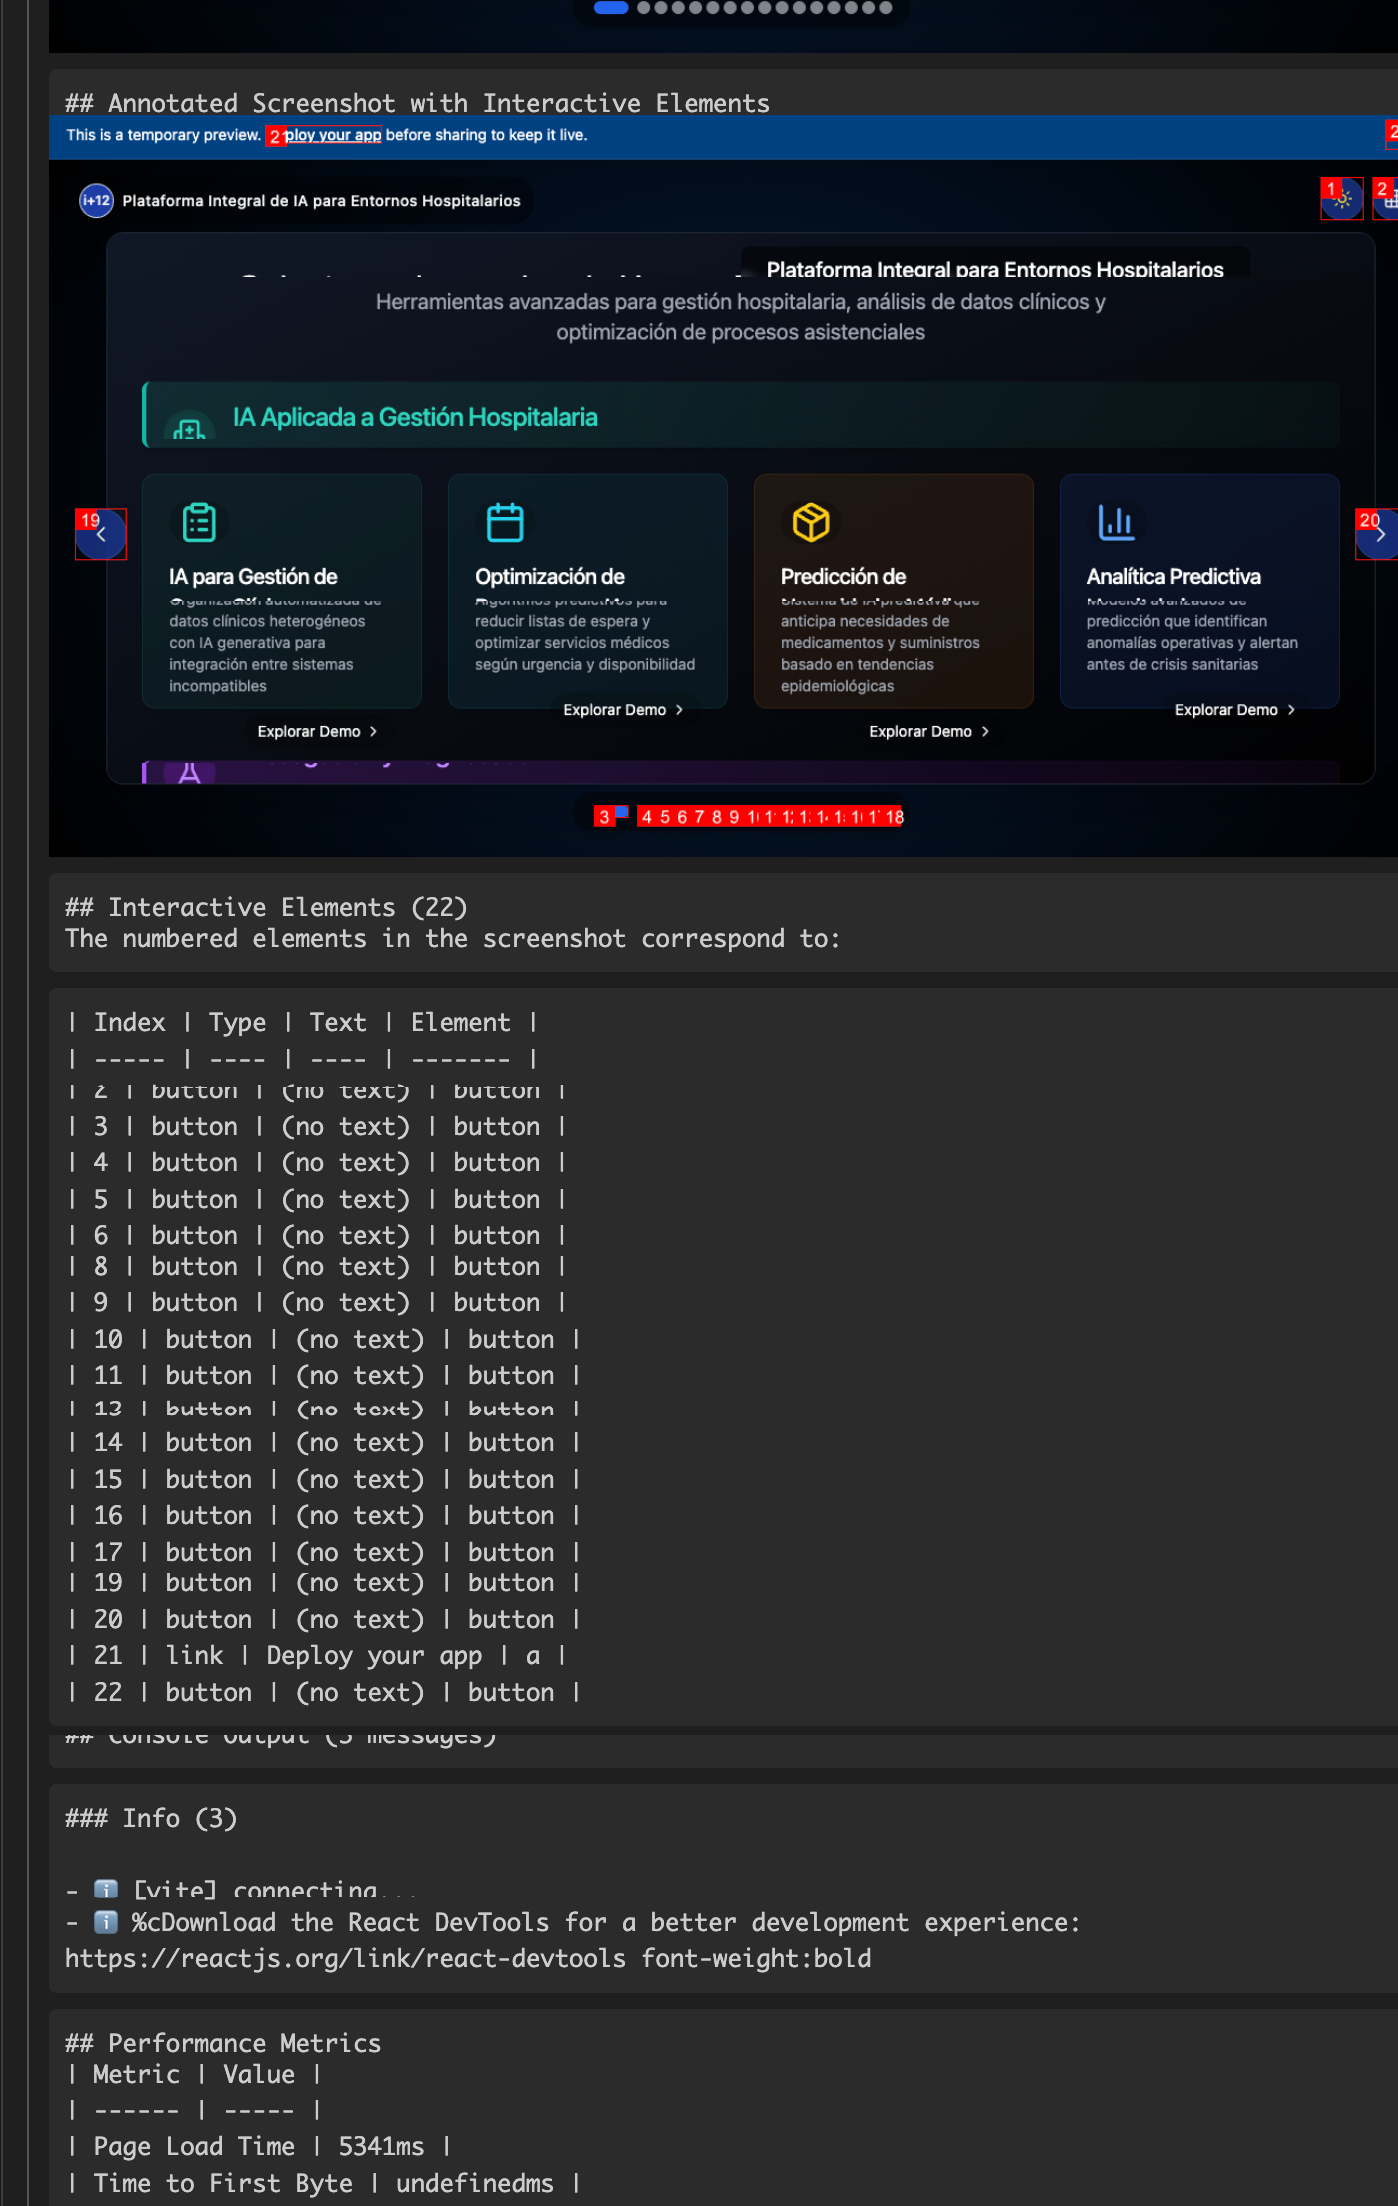
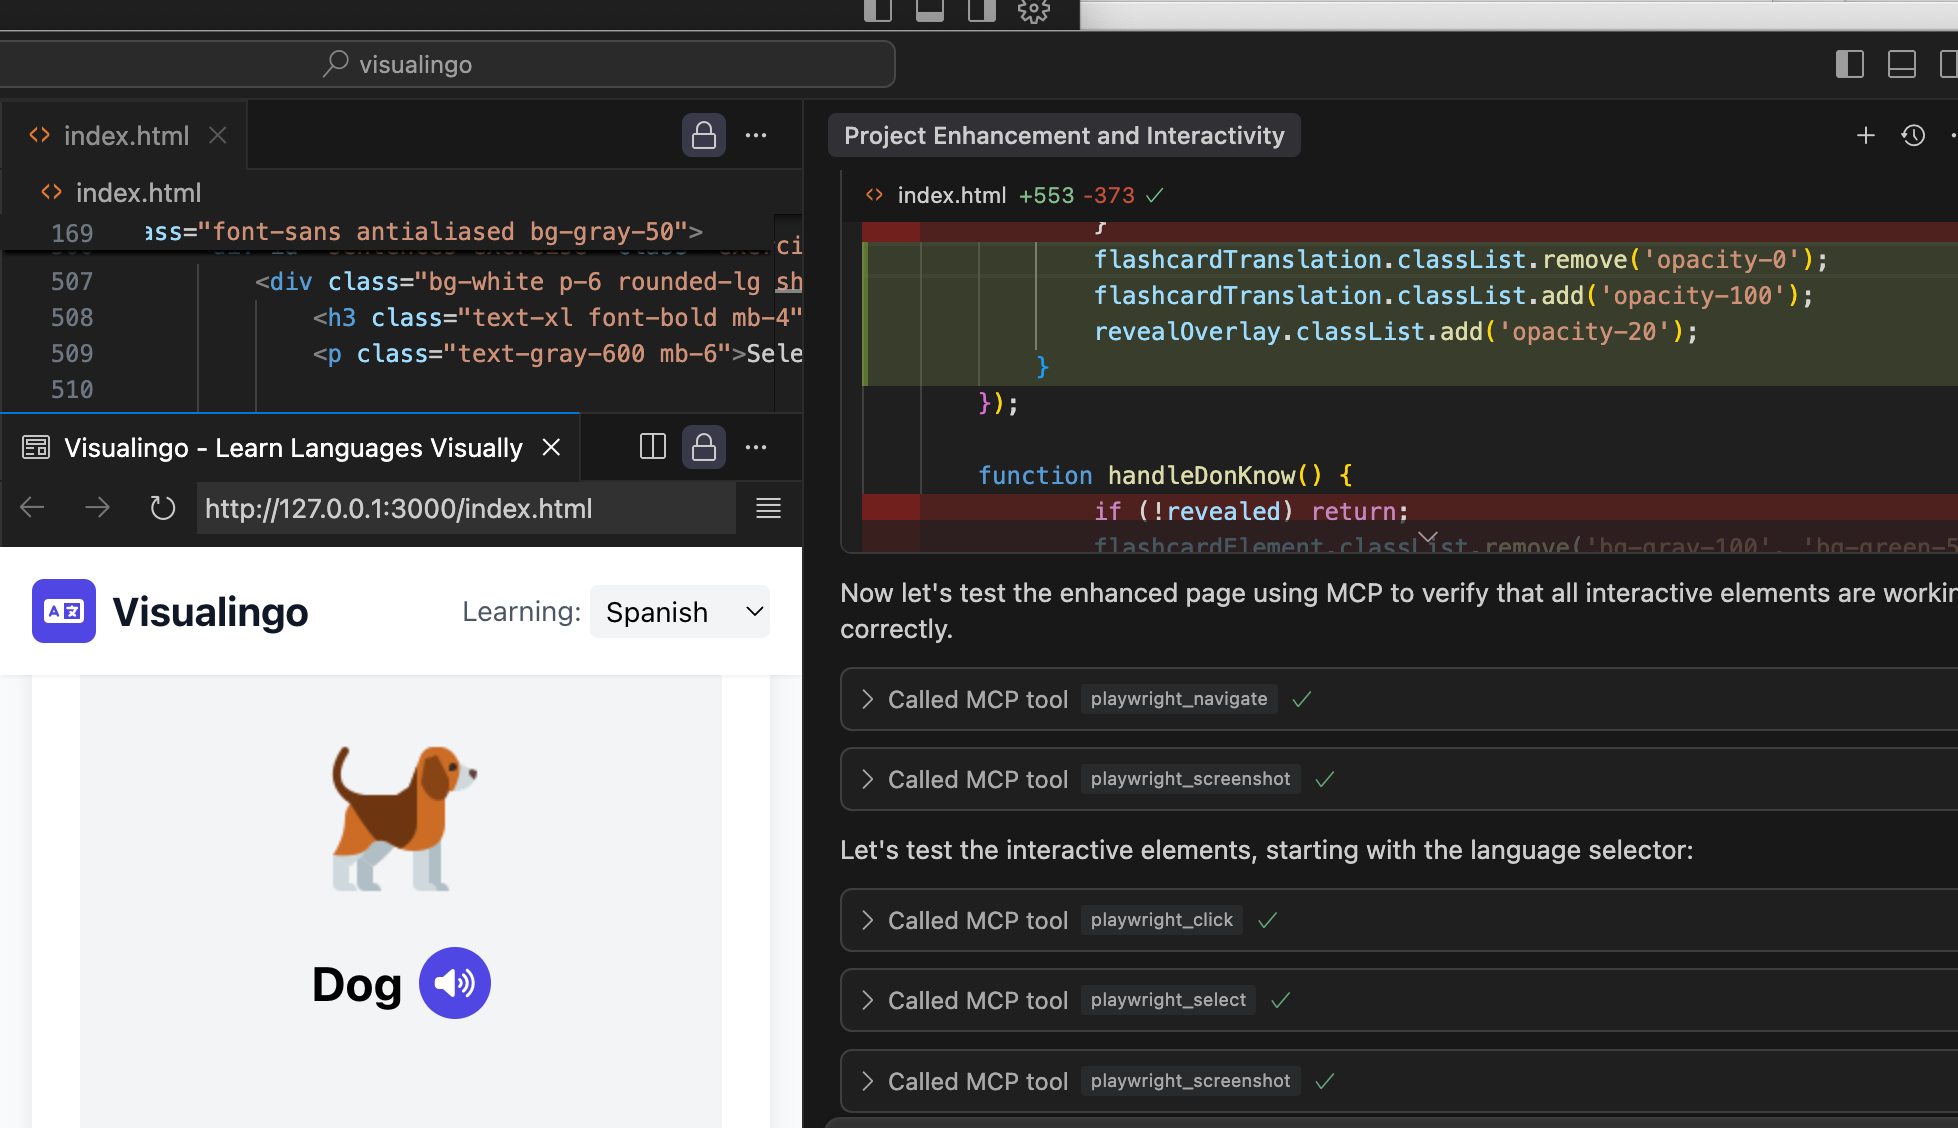
VUDA is an autonomous debugging agent that empowers AI models to visually analyze, test, and debug web interfaces through Playwright. This MCP server enables any AI model (even those without built-in vision capabilities) to visually inspect web pages, find UI bugs, test user workflows, and validate application performance - all without human intervention.
VUDA functions as an AI-powered autonomous debugging agent that can:
- Perform comprehensive visual analysis of web applications
- Detect UI issues by inspecting visual elements and their properties
- Automatically test common user workflows without manual test script creation
- Validate API endpoints and verify backend responses
- Track visual changes between application versions
- Monitor console logs for errors and warnings
- Analyze performance metrics to identify bottlenecks
- Generate detailed reports with screenshots and recommendations
The agent is designed to work intelligently, reusing browser sessions, avoiding unnecessary file creation, and focusing on the most important aspects of your application.
The easiest way to install VUDA is through any MCP-compatible gateway:
# Example with Claude gateway
claude-gateway install visual-ui-debug-agent-mcpUse our one-line installation script:
curl -s https://raw.githubusercontent.com/samihalawa/visual-ui-debug-agent-mcp/main/scripts/install-global.sh | bashFor global installation via npm:
# Install globally
npm install -g visual-ui-debug-agent-mcp

# Start the server
vuda
# or
visual-ui-debug-agentFor containerized deployment:
# Pull the image from Docker Hub
docker pull luigi1234/visual-ui-debug-agent:latest

# Run the container
docker run -p 8080:8080 luigi1234/visual-ui-debug-agent:latestVUDA is fully Smithery-compatible using the included configuration file:
# Install with Smithery
smithery install visual-ui-debug-agent-mcp

# Or run with your API key
npm run smithery:key YOUR_SMITHERY_API_KEY
For full installation and usage instructions, see the Smithery Integration Guide.
Platform-specific packages are available for all major platforms:
# For macOS (Intel or Apple Silicon)
npm install -g visual-ui-debug-agent-mcp-darwin-x64
npm install -g visual-ui-debug-agent-mcp-darwin-arm64

# For Linux
npm install -g visual-ui-debug-agent-mcp-linux-x64
npm install -g visual-ui-debug-agent-mcp-linux-arm64

# For Windows
npm install -g visual-ui-debug-agent-mcp-win32-x64Provides comprehensive analysis of web pages with interactive elements mapping, performance metrics, and visual inspection.
const analysis = await mcp.callTool("enhanced_page_analyzer", {
  url: "https://example.com/dashboard",
  includeConsole: true,
  mapElements: true,
  fullPage: true
});Automatically tests full user journeys by executing and validating a sequence of UI interactions.
const result = await mcp.callTool("ui_workflow_validator", {
  startUrl: "https://example.com/login",
  taskDescription: "User login flow",
  steps: [
    { description: "Enter username", action: "fill", selector: "#username", value: "test" },
    { description: "Enter password", action: "fill", selector: "#password", value: "pass" },
    { description: "Click login", action: "click", selector: "button[type='submit']" },
    { description: "Verify dashboard loads", action: "verifyElementVisible", selector: ".dashboard" }
  ],
  captureScreenshots: "all"
});Compares two web pages or UI states to identify visual differences.
const diff = await mcp.callTool("visual_comparison", {
  url1: "https://example.com/before",
  url2: "https://example.com/after",
  threshold: 0.05
});Captures high-quality screenshots of any URL with options for full page or specific elements.
const screenshot = await mcp.callTool("screenshot_url", {
  url: "https://example.com/profile",
  fullPage: true,
  device: "iPhone 13"
});Takes screenshots of multiple URLs in a single operation for efficient comparison.
const screenshots = await mcp.callTool("batch_screenshot_urls", {
  urls: ["https://example.com/page1", "https://example.com/page2"],
  fullPage: true
});Tests multi-step navigation sequences with validation.
const navResult = await mcp.callTool("navigation_flow_validator", {
  startUrl: "https://example.com",
  steps: [
    { action: "click", selector: "a.products" },
    { action: "wait", waitTime: 1000 },
    { action: "click", selector: ".product-item" }
  ],
  captureScreenshots: true
});Tests multiple API endpoints and verifies responses for backend validation.
const apiTest = await mcp.callTool("api_endpoint_tester", {
  url: "https://api.example.com/v1",
  endpoints: [
    { path: "/users", method: "GET" },
    { path: "/products", method: "GET" }
  ],
  authToken: "Bearer token123"
});Inspects DOM elements and their properties in detail.
const elementInfo = await mcp.callTool("dom_inspector", {
  url: "https://example.com",
  selector: "nav.main-menu",
  includeChildren: true,
  includeStyles: true
});Monitors and captures console logs for error detection.
const logs = await mcp.callTool("console_monitor", {
  url: "https://example.com/app",
  filterTypes: ["error", "warning"],
  duration: 5000
});Measures and analyzes page load performance metrics.
const perfMetrics = await mcp.callTool("performance_analysis", {
  url: "https://example.com/dashboard",
  iterations: 3
});Takes screenshots of local HTML files.
const localScreenshot = await mcp.callTool("screenshot_local_files", {
  filePath: "/path/to/local/file.html"
});Complete set of low-level Playwright controls for precise automation:
-
playwright_navigate: Navigate to specific URLs -
playwright_click: Click on elements -
playwright_iframe_click: Click elements inside iframes -
playwright_fill: Fill form fields -
playwright_select: Select dropdown options -
playwright_hover: Hover over elements -
playwright_evaluate: Run JavaScript in the page context -
playwright_console_logs: Get console logs -
playwright_get_visible_text: Extract visible text -
playwright_get_visible_html: Get visible HTML -
playwright_go_back: Navigate back -
playwright_go_forward: Navigate forward -
playwright_press_key: Press keyboard keys -
playwright_drag: Drag and drop elements -
playwright_screenshot: Take custom screenshots
Helps with exposing local ports via Cloudflare tunnel for remote debugging access.
// Guide the user through tunnel setup
const guide = await mcp.callTool("tunnel_helper", {
  action: "guide",
  port: 3000
});

// Store a tunnel URL for later use
await mcp.callTool("tunnel_helper", {
  action: "store",
  port: 3000,
  url: "https://example.trycloudflare.com"
});

// Retrieve stored tunnel URLs
const tunnels = await mcp.callTool("tunnel_helper", {
  action: "retrieve"
});Saves and retrieves debugging context, environment variables, and important findings.
// Save debugging context
await mcp.callTool("debug_memory", {
  action: "save",
  key: "api_config",
  data: {
    baseUrl: "https://api.example.com",
    apiKey: "sk-123...",
    endpoints: ["/users", "/products"]
  }
});

// Retrieve saved context
const config = await mcp.callTool("debug_memory", {
  action: "retrieve",
  key: "api_config"
});

// List all saved items
const allItems = await mcp.callTool("debug_memory", {
  action: "list"
});

// Clear all saved data
await mcp.callTool("debug_memory", {
  action: "clear"
});VUDA can autonomously perform complete debugging workflows by combining tools. For example:
// 1. Analyze the current version
const currentAnalysis = await mcp.callTool("enhanced_page_analyzer", {...});

// 2. Compare with previous version
const comparisonResult = await mcp.callTool("visual_comparison", {...});

// 3. Generate visual difference report
const report = await mcp.callTool("ui_workflow_validator", {...});// 1. Start with login flow
const loginResult = await mcp.callTool("ui_workflow_validator", {...});
// 2. Validate core features
const featureResults = await mcp.callTool("navigation_flow_validator", {...});
// 3. Test API endpoints
const apiResults = await mcp.callTool("api_endpoint_tester", {...});// 1. Analyze initial performance
const initialPerformance = await mcp.callTool("performance_analysis", {...});
// 2. Identify slow-loading elements
const elementPerformance = await mcp.callTool("dom_inspector", {...});
// 3. Monitor console for errors
const consoleErrors = await mcp.callTool("console_monitor", {...});VUDA automatically maps all interactive elements on a page, making it easy for an AI model to understand the UI structure.
The visual comparison tool highlights differences between UI states, perfect for catching unexpected visual changes.
# smithery.yaml configuration
startCommand:
  type: stdio
  configSchema:
    type: object
    properties:
      port:
        type: number
        description: Port number for the MCP server
      debug:
        type: boolean
description: Enable debug mode// glama.json configuration
{
"name": "visual-ui-debug-agent-mcp",
"version": "1.0.0",
"settings": {
"port": 8080,
"headless": true,
"maxConcurrentSessions": 5
}
}VUDA converts visual information into structured data that can be used by any AI model, even those without vision capabilities:
// The model receives structured data about visual elements
{
  "interactiveElements": [
    {
      "tagName": "button",
      "text": "Submit",
      "bounds": {"x": 120, "y": 240, "width": 100, "height": 40},
      "visible": true
    },
    // More elements...
  ]
}VUDA includes GitHub Actions workflows for continuous integration and deployment:
- Build and Test: Validates code quality
- NPM Publishing: Automates package publishing
- Docker Publishing: Creates and pushes Docker images
- Smithery Publishing: Deploys to Smithery platform
This project is licensed under the ISC License


