UduJS
A simple universal debugging utility for JavaScript code. Designed for Node.js and browsers.
Make debugging more understandable and simple.
Support
Tested in:
- Node.js 6-8.
- Google Chrome 62-63.
- Firefox Developer Edition 57-58.
Do you have suggestions, wishes or comments? Welcome to issue tracker!
Installation
$ npm i udujsor
$ yarn add udujsUsage
Inclusion in the project
Server code:
- standard way (automatic definition of the working environment);
const UduJS = require('udujs');
const Debug = new UduJS();- direct connection of server methods.
const UduJS = require('udujs/Server');
const Debug = new UduJS();Note: both these methods of inclusion are almost identical. You can apply any of them.
Code on the client:
- standard way (not recommended);
const UduJS = require('udujs');
const Debug = new UduJS();- direct connection of client methods;
const UduJS = require('udujs/Client');
const Debug = new UduJS();- connect the compiled library directly to the HTML file (folder
compiled).
<script src="js/mod/udujs-1.0.0.min.js"></script> <!-- For example -->
<script>
  var Debug = new UduJS();
</script>Note: the standard method of inclusion can lead to swelling of files when compiling a bundle.
Customizing
When creating an instance of the utility, you can specify an object with custom settings. This will help you adjust the debugging process a little. For example:
const UduJS = require('udujs/Client');
const Debug = new UduJS({
  maxWidth: 'auto',
  fontSize: '1.2em',
  decimalPlaces: 4,
  popupColorScheme: 'dark',
});
General methods
.log(value, [comment]) API
Outputs debugging information to the console. This method returns nothing.
const someVariable = +100500;
Debug.log(someVariable);
Result (example code with common methods):
.rttPoint([name]) ⇒ number API
Run-time testing (RTT). Sets the control point in the code. Calculates the code execution time between two control points (in milliseconds).
- Displays the calculated value in the console.
- Returns the calculated value.
Debug.rttPoint();
someCode();
Debug.rttPoint('Some code was executed.');
someCode();
// Or, the result of the method can be assigned to a variable.
let lastPointResult = Debug.rttPoint('More code.');
Result (example code with common methods):
.rttStart([name], [levelIndex]) API
Run-time testing (RTT). The starting point for computing the execution time of some code. This method returns nothing.
.rttFinish([levelIndex]) ⇒ number API
Run-time testing (RTT).
The end point for the rttStart() method.
Calculates the execution time of the code between the start and current points (in milliseconds).
- Displays the calculated value in the console.
- Returns the calculated value.
Debug.rttStart('Single testing of some code.');
someCode();
Debug.rttFinish();
// Or, the result of the method can be assigned to a variable.
let rttResult = Debug.rttFinish();
Result (example code with common methods):
.rttAverage(codeContainer, cycles, [name], [timeEachIteration]) ⇒ number API
Run-time testing (RTT). Calculates the average execution time of some code (in milliseconds).
- Displays the calculated value in the console.
- Returns the calculated value.
Debug.rttAverage(someCode, 3, 'The average execution time of some code.', true);
// Or, the result of the method can be assigned to a variable.
let averageResult = Debug.rttAverage(someCode, 3, 'The average execution time of some code.', true);
Result (example code with common methods):
.stopExec() API
The method stops execution of the utility. This method returns nothing.
.resumeExec() API
The method resumes execution of the utility. This method returns nothing.
Debug.stopExec();
// The application code between these methods will be executed.
someCode(); // This code will be executed.
// Utility methods, on the contrary, will be ignored.
Debug.log('This method will be ignored.');
Debug.resumeExec();
Client methods
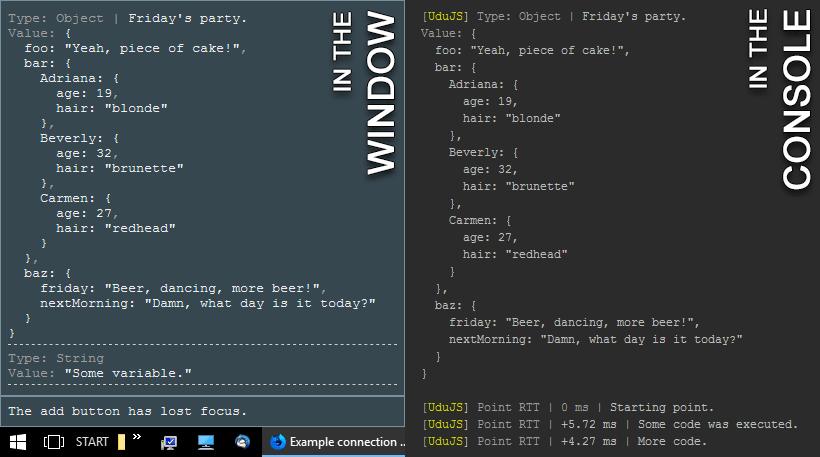
.popup() API
Displays debugging information in the list in a pop-up message in the browser window. This method returns nothing.
const someVariable = +100500;
Debug.popup(someVariable);
Result (example code with client methods):
.popupReset() API
Clears the list in a pop-up message. This method returns nothing.
Debug.popupReset();Result (example code with client methods):
.show() API
A universal method for displaying debugging information.
Outputs either to the console or to a pop-up message.
The output direction is controlled via the configuration (parameter showOutputDirection).
By default, the information is displayed in a pop-up message.
This method returns nothing.
const someVariable = +100500;
Debug.show(`Using the "show()" method: ${someVariable}`);
Result (example code with client methods):
.observer() API
Displays debug information in a fixed field in a pop-up message. This method returns nothing.
const someStatus = true;
Debug.observer(`Some status: ${someStatus}`);
Result (example code with client methods):


