Reporter
Logging results of tests and load server with Selenium environment based on Docker.
Infrastructure of log management
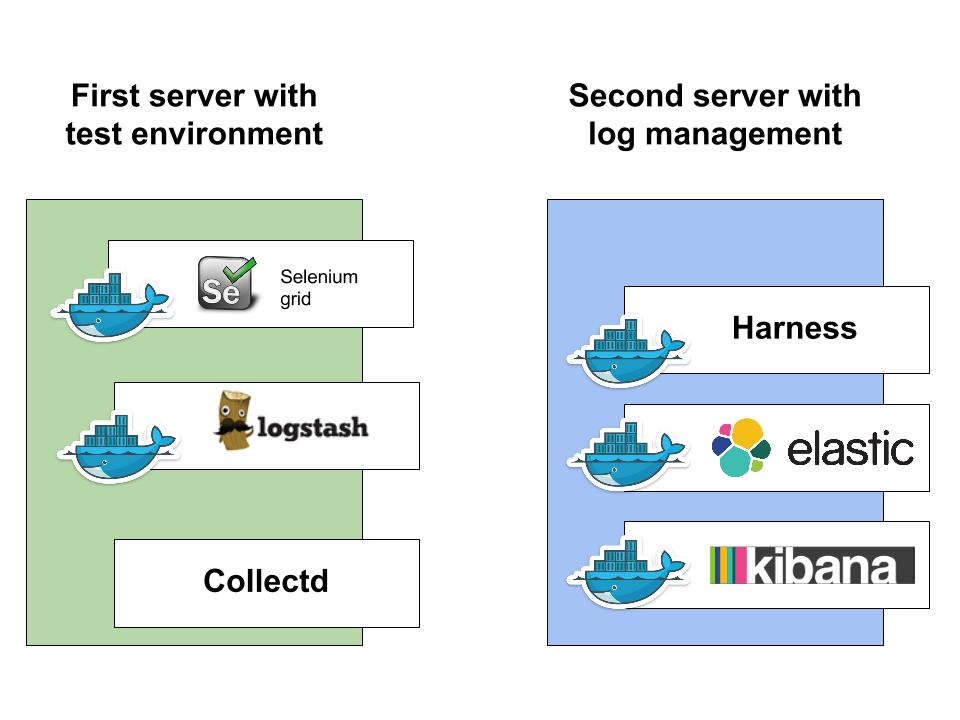
Configuration Harness
You must add to ./config.cson ELASTICSEARCH: "IP_OF_ELASTICSEARCH:PORT"
And run your Harness with -R elastic option
Collectd
Collectd - The system statistics collection daemon
Collectd installation
sudo apt-get update
sudo apt-get install collectd collectd-utils
Collectd configuration
Edit your /etc/collectd/collectd.conf
Apply changes sudo service collectd restart
Logstash
Logstash configuration
Create ~/logstashConf/collectd.conf
Run Logstash
docker run -d -v /logstashConf/:/conf --name logstash -p 25826:25826/udp itzg/logstash:latest
Running docker containers
$ docker ps

CONTAINER ID        IMAGE                         COMMAND                CREATED             STATUS              PORTS                                 NAMES
d638f1381344        selenium/node-chrome:2.46.0   /opt/bin/entry_point   29 hours ago        Up 29 hours                                               pensive_franklin
bf04464fa6b7        selenium/hub:2.46.0           /opt/bin/entry_point   29 hours ago        Up 29 hours         0.0.0.0:4444->4444/tcp                pensive_franklin/hub,selenium-hub
69549b3c871a        itzg/logstash:latest          bin/logstash agent -   12 days ago         Up 29 hours         25826/tcp, 0.0.0.0:25826->25826/udp   logstash
Verify that Collectd running
$ service collectd status
 * collectd is running
Kibana settings
Open Kibana http://yourServerAddress:5601/
Import Dashboards
Kibana > Settings > Objects > Import this json
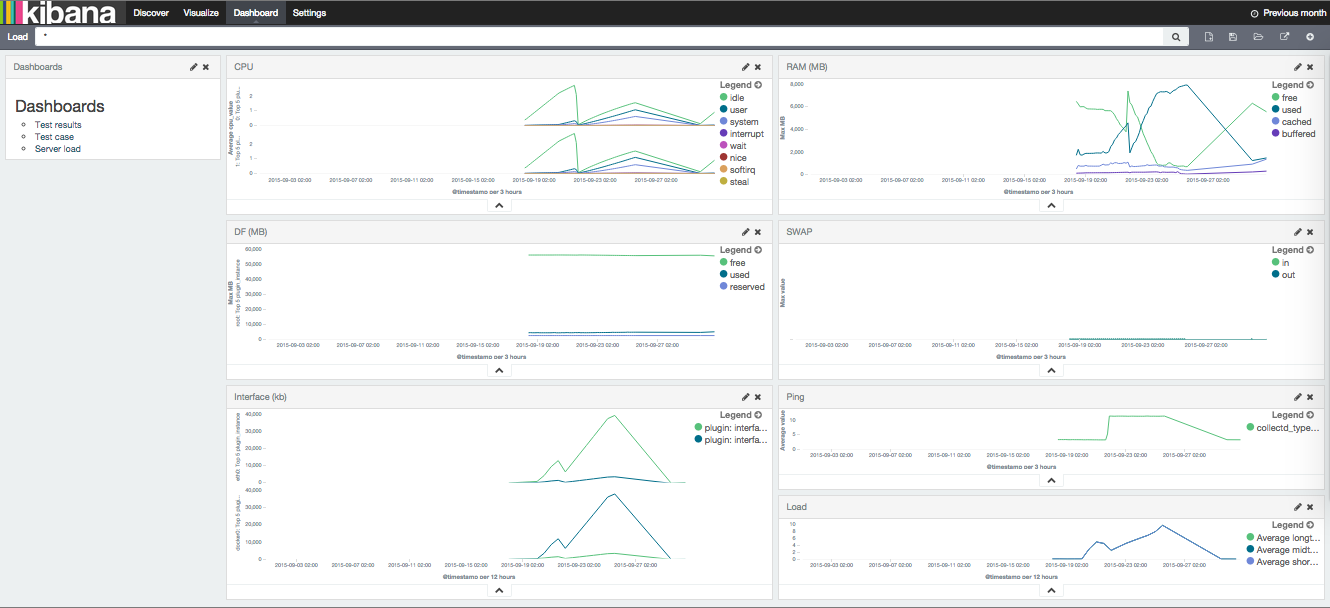
Server load dashboard
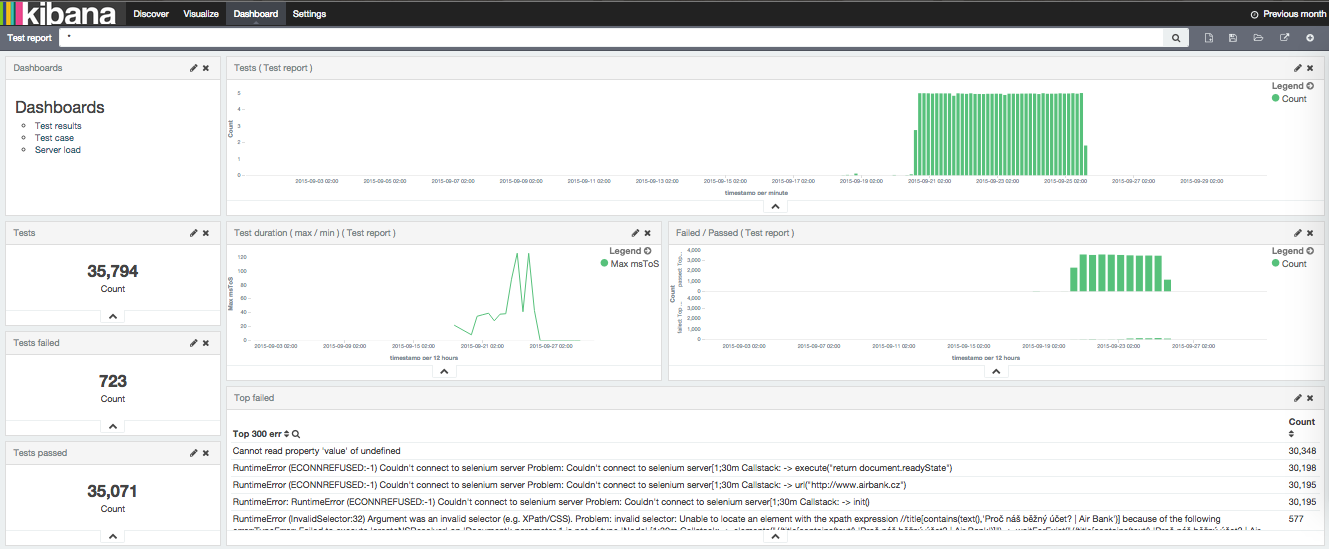
Test results dashboard
Import Visualization
Kibana > Settings > Objects > Import this json
Add Script fields
For testreport index
Kibana > Settings > testreport > Script fields
name: msToS
script: doc['testCaseDuration'].value / 1000
For collectd index
Kibana > Settings > collectd > Script fields
name: MB
script: doc['value'].value / 1000000

name: cpu_value
script: doc['value'].value / 10000000

name: ms
script: doc['value'].value / 1000

name: txToKbe
script: doc['tx'].value / 1024 / 1024

name: rxToKb
script: doc['rx'].value / 1024 / 1024