![]()
swagger-stats
http://swaggerstats.io | Documentation | API DOC | API SPEC


API Telemetry and APM
Trace API calls and Monitor API performance, health and usage statistics in Node.js Microservices
swagger-stats traces REST API requests and responses in Node.js Microservices, and collects statistics per API Operation. swagger-stats detects API operations based on express routes. You may also provide Swagger (Open API) specification, and swagger-stats will match API requests with API Operations defined in swagger specification.
swagger-stats exposes statistics and metrics per API Operation, such as GET /myapi/:parameter, or GET /pet/{petId}
Built-In API Telemetry
swagger-stats provides built-in Telemetry UI, so you may enable swagger-stats in your app, and start monitoring immediately, with no infrastructure requirements. Navigate to
http://<your app host:port>/swagger-stats/ui
API Analytics with Elasticsearch and Kibana
swagger-stats stores details about each request/response in Elasticsearch, so you may use Kibana to perform detailed analysis of API usage over time, build visualizations and dashboards

See dashboards/elastic6 for swagger-stats Kibana visualizations and dashboards
Monitoring and Alerting with Prometheus and Grafana
swagger-stats exposes metrics in Prometheus format, so you may use Prometheus and Grafana to setup API monitoring and alerting

See dashboards/prometheus for swagger-stats Grafana dashboards
With statistics and metrics exposed by swagger-stats you may spot problematic API endpoints, see where most of errors happens, catch long-running requests, analyze details of last errors, observe trends, setup alerting.
swagger-stats provides:
- Metrics in Prometheus format, so you may use Prometheus and Grafana to setup API monitoring and alerting
- Storing details about each API Request/Response in Elasticsearch, so you may use Kibana to perform analysis of API usage over time, build visualizations and dashboards
- Built-in API Telemetry UI, so you may enable swagger-stats in your app, and start monitoring right away, with no additional tools required
- Exposing collected statistics via API, including:
- Counts of requests and responses(total and by response class), processing time (total/avg/max), content length(total/avg/max) for requests and responses, rates for requests and errors. This is baseline set of stats.
- Statistics by Request Method: baseline stats collected for each request method
- Timeline: baseline stats collected for each 1 minute interval during last 60 minutes. Timeline helps you to analyze trends.
- Errors: count of responses per each error code, top "not found" resources, top "server error" resources
- Last errors: request and response details for the last 100 errors (last 100 error responses)
- Longest requests: request and response details for top 100 requests that took longest time to process (time to send response)
- Tracing: Request and Response details - method, URLs, parameters, request and response headers, addresses, start/stop times and processing duration, matched API Operation info
- API Statistics: baseline stats and parameter stats per each API Operation. API operation detected based on express routes, and based on Swagger (Open API) specification
- CPU and Memory Usage of Node process
How to Use
Install
npm install swagger-stats --save
Enable swagger-stats middleware in your app
var swStats = require('swagger-stats');
var apiSpec = require('swagger.json');
app.use(swStats.getMiddleware({swaggerSpec:apiSpec}));
See /examples for sample apps
Get Statistics with API
$ curl http://<your app host:port>/swagger-stats/stats
{
  "startts": 1501647865959,
  "all": {
    "requests": 7,
    "responses": 7,
    "errors": 3,
    "info": 0,
    "success": 3,
    "redirect": 1,
    "client_error": 2,
    "server_error": 1,
    "total_time": 510,
    "max_time": 502,
    "avg_time": 72.85714285714286,
    "total_req_clength": 0,
    "max_req_clength": 0,
    "avg_req_clength": 0,
    "total_res_clength": 692,
    "max_res_clength": 510,
    "avg_res_clength": 98,
    "req_rate": 1.0734549915657108,
    "err_rate": 0.4600521392424475
  },
  "sys": {
    "rss": 59768832,
    "heapTotal": 36700160,
    "heapUsed": 20081776,
    "external": 5291923,
    "cpu": 0
  },
  "name": "swagger-stats-testapp",
  "version": "0.90.1",
  "hostname": "hostname",
  "ip": "127.0.0.1"
}
Take a look at Documentation for more details on API and returned statistics.
Get Prometheus Metrics
$ curl http://<your app host:port>/swagger-stats/metrics
# HELP api_all_request_total The total number of all API requests received
# TYPE api_all_request_total counter
api_all_request_total 88715
# HELP api_all_success_total The total number of all API requests with success response
# TYPE api_all_success_total counter
api_all_success_total 49051
# HELP api_all_errors_total The total number of all API requests with error response
# TYPE api_all_errors_total counter
api_all_errors_total 32152
# HELP api_all_client_error_total The total number of all API requests with client error response
# TYPE api_all_client_error_total counter
api_all_client_error_total 22986

. . . . . . . . . .
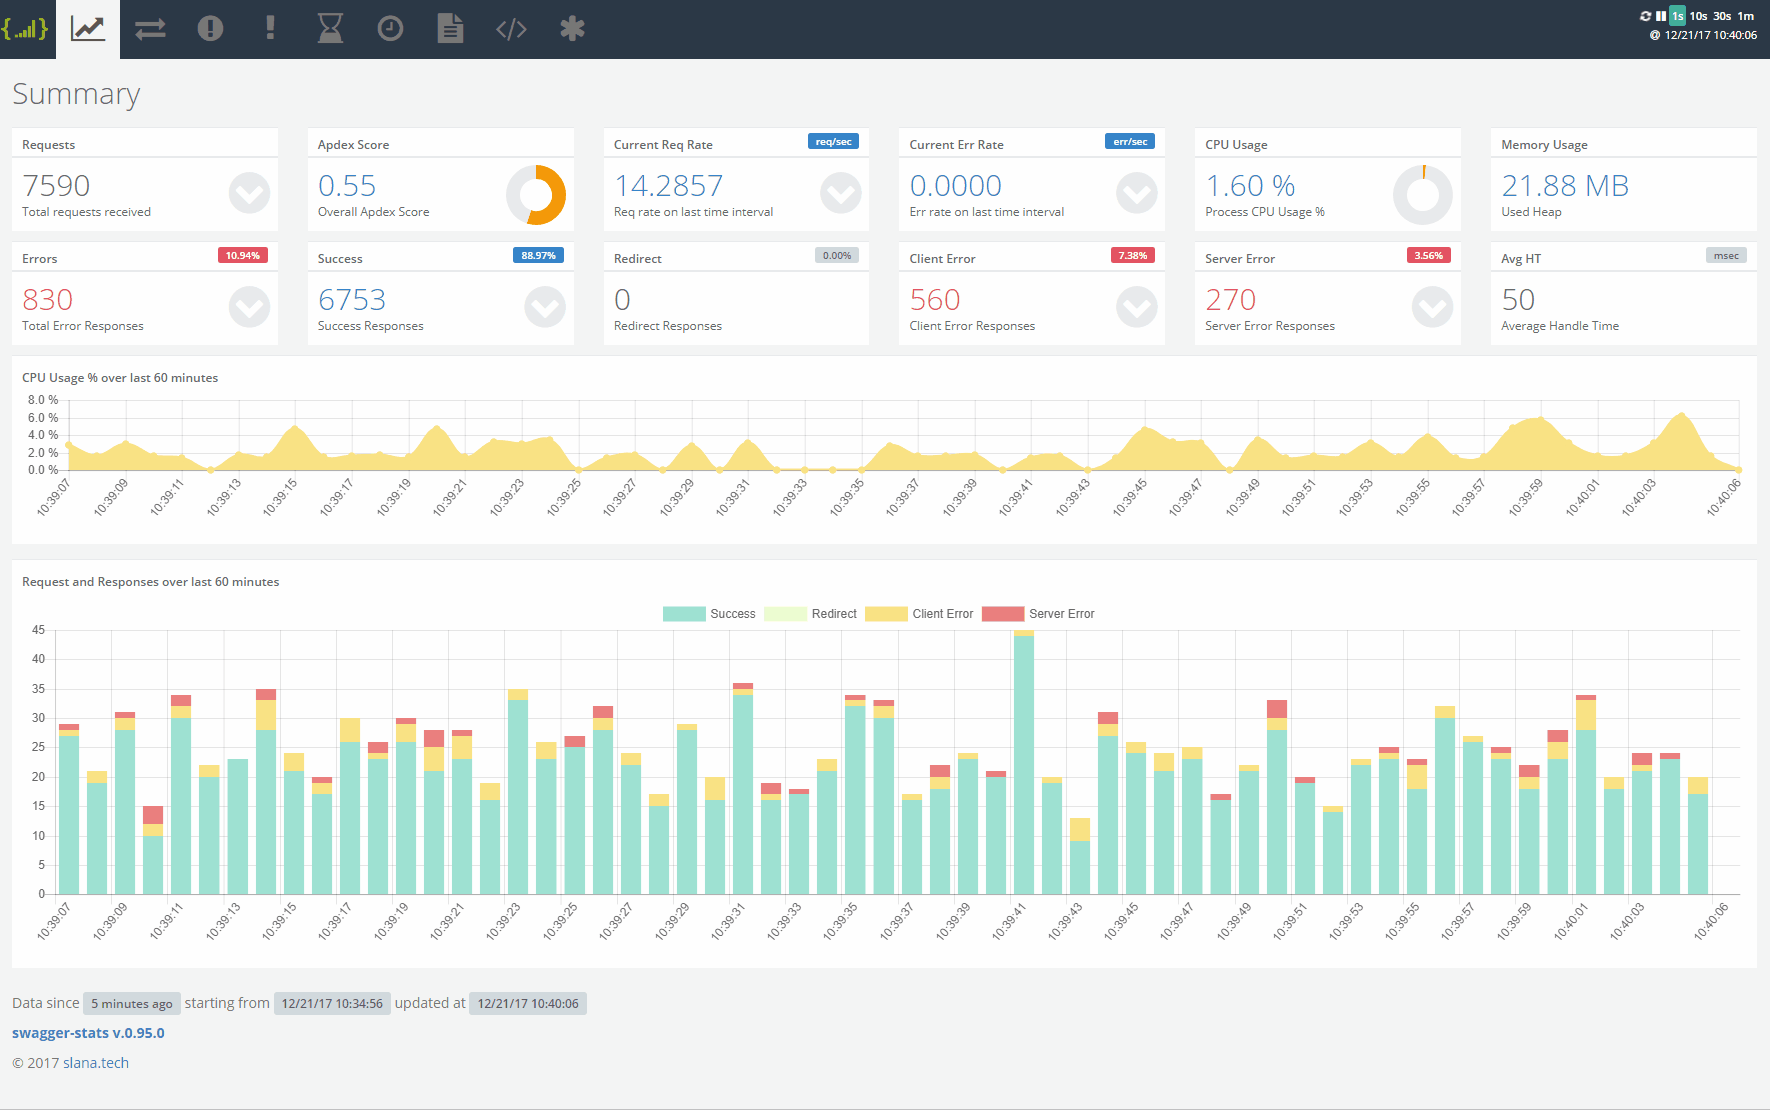
Embedded Monitoring User Interface
Swagger-stats comes with built-in User Interface. Navigate to /swagger-stats/ui in your app to start monitoring right away
http://<your app host:port>/swagger-stats/ui
Key metrics

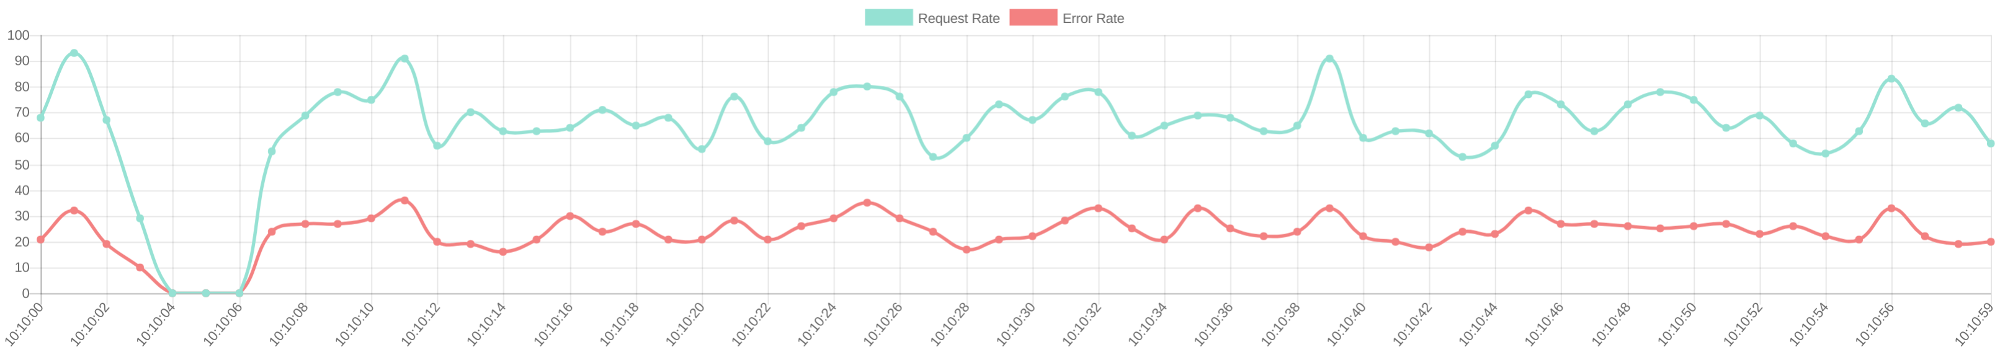
Timeline

Request and error rates
API Operations

Stats By Method

Updates
v0.95.6
-
[bug] Last Errors and Errors tab no populated using FeatherJS #42
-
[bug] Request Content Length null or undefined #40
v0.95.5
-
[feature] Allow onAuthenticate to be asynchronous #31
-
[feature] Prevent tracking of specific routes #36
-
[feature] Support for extracting request body #38
Thanks to DavisJaunzems!
v0.95.0
- [feature] Elasticsearch support #12
swagger-stats now supports storing details about each API Request/Response in Elasticsearch, so you may use Kibana to perform analysis of API usage over time, build visualizations and dashboards.
Example Kibana dashboards provided in dashboards/elastic6
v0.94.0
-
[feature] Apdex score #10
-
[feature] Support Authentication for /stats and /metrics #14
-
[feature] Add label "code" to Prometheus histogram metrics #21
See updated dashboard at Grafana Dashboards
v0.93.1
- [bug] Can't start on node v7.10.1, Mac Os 10.12.6 #22
v0.93.0
- [feature] Support providing Prometheus metrics via prom-client library #20
v0.92.0
- [feature] OnResponseFinish hook: pass request/response record to callback so app can post proceses it add it to the log #5
v0.91.0
- [feature] Option to specify alternative URI path for ui,stats and metrics #17
app.use(swStats.getMiddleware({
   uriPath: '/myservice',
   swaggerSpec:swaggerSpec
}));
$ curl http://<your app host:port>/myservice/stats
v0.90.3
- [feature] Added new chart to API Operation Page #16
- handle time histogram
- request size histogram
- response size histogram
- response codes counts
v0.90.2
- [feature] Added Prometheus metrics and Grafana dashboards #9
v0.90.1
- [feature] Added CPU and Memory Usage Stats and monitoring in UI #8
Enhancements and Bug Reports
If you find a bug, or have an enhancement in mind please post issues on GitHub.
License
MIT