SVG-Spider-Chart
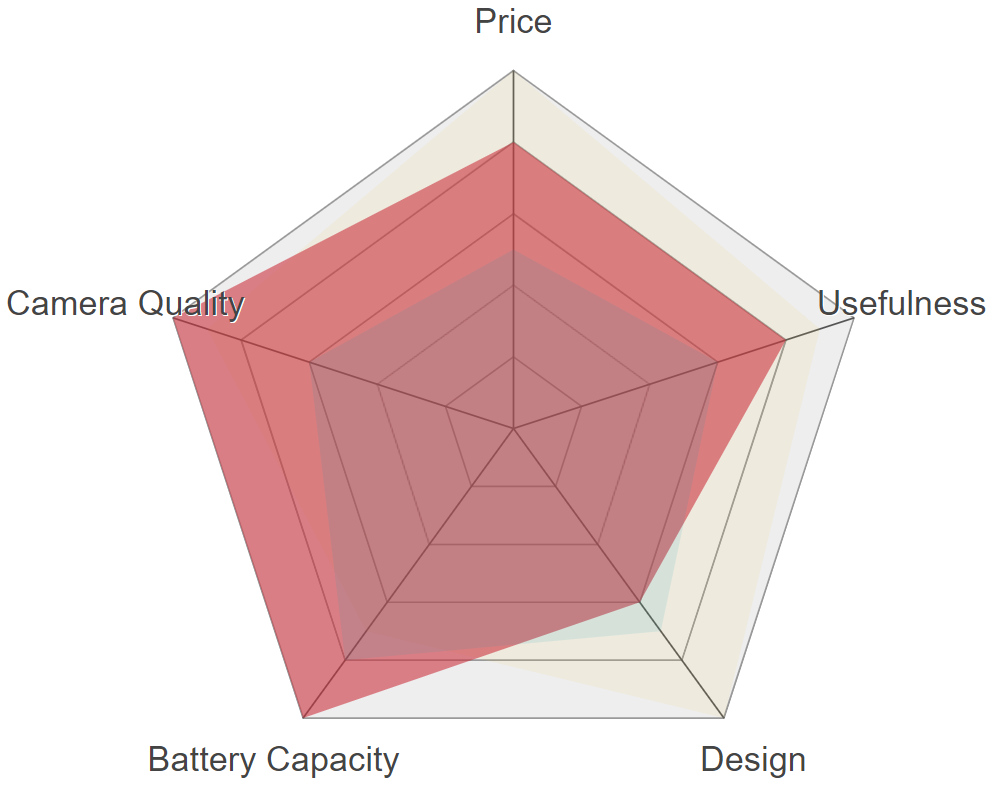
SVG-based spider chart, a.k.a. radar chart, based on Derhuerst's version. The main differences are:
- The virtual dom library can be injected, for example, you can inject mithril's
mfunction. - By default, a spider chart is displayed instead of a radar chart, i.e. using linear scale lines instead of circles.
- It provides a Mithril component factory,
SpiderChartFactory, to createSpiderChartsby injecting mithril'smfunction. - You can specify a CSS style to use in the options (so when you save it, the CSS style is saved too).
- Using Typescript also provides type definitions.
Playground
To play around with the component using mithril, please visit flems.
Usage
You can either use the SpiderChartFactory to create your own SpiderChart by injecting the virtual dom function factory (in the example below, mithril is used). Or alternatively, you can import the render function, and render the content inside your own SVG (it generates the plain chart, without svg element around it).
import m from 'mithril';
import {
  SpiderChartFactory,
  SpiderColumns,
  SpiderData,
  SpiderOptions,
} from 'svg-spider-chart';


const columns = {
  price: 'Price',
  useful: 'Usefulness',
  design: 'Design',
  battery: 'Battery Capacity',
  camera: 'Camera Quality',
} as SpiderColumns;

const data = [
  {
    // iphone
    color: '#edc951',
    price: 1,
    battery: 0.7,
    design: 1,
    useful: 0.9,
    camera: 0.9,
  },
  {
    // galaxy
    color: '#cc333f',
    price: 0.8,
    battery: 1,
    design: 0.6,
    useful: 0.8,
    camera: 1,
  },
  {
    // nexus
    color: '#00a0b0',
    price: 0.5,
    battery: 0.8,
    design: 0.7,
    useful: 0.6,
    camera: 0.6,
  },
] as SpiderData[];

// Inject the m function
const SpiderChart = SpiderChartFactory(m);

// Render the chart
m.render(
  document.body,
  m(SpiderChart, {
    id: 'demo-target',
    columns,
    data,
    width: '100%',
    viewBox: '-10 0 120 100',
    options: {
      size: 100,
      scales: 5,
      scaleType: 'spider',
      shapeProps: (data) => ({
        className: 'shape',
        fill: data.color as string,
      }),
    } as Partial<SpiderOptions>,
  }),
);
import m from 'mithril';
import { render } from 'svg-spider-chart';
// Use the render function
const renderer = render(m);
const spiderChart = renderer(columns, data, options);Default options
The following default options are used: tweak them as you see fit.
const defaults = {
  size: 100, // size of the chart (including captions)
  axes: true, // show axes?
  scales: 3, // show scale circles?
  scaleType: 'spider',
  captions: true, // show captions?
  captionsPosition: 1.2, // where on the axes are the captions?
  smoothing: noSmoothing, // shape smoothing function
  axisProps: () => ({ className: 'axis' }),
  scaleProps: () => ({ className: 'scale', fill: 'none' }),
  shapeProps: () => ({ className: 'shape' }),
  captionProps: () => ({
    className: 'caption',
    'text-anchor': 'middle',
    'font-size': 3,
    'font-family': 'sans-serif',
  }),
} as Partial<SpiderOptions>;
