ci-reports
reports for ci


$ npm install -g sfdx-ci-reports
$ sfdx COMMAND
running command...
$ sfdx (-v|--version|version)
sfdx-ci-reports/0.0.2 darwin-x64 node-v15.6.0
$ sfdx --help [COMMAND]
USAGE
  $ sfdx COMMAND
...
sfdx sfci:coverage -i <string> -r <string> -f <string> [-u <string>] [--apiversion <string>] [--json] [--loglevel trace|debug|info|warn|error|fatal|TRACE|DEBUG|INFO|WARN|ERROR|FATAL]sfdx sfci:report -f <string> [-i <string>] [-u <string>] [--apiversion <string>] [--json] [--loglevel trace|debug|info|warn|error|fatal|TRACE|DEBUG|INFO|WARN|ERROR|FATAL]
sfdx sfci:coverage -i <string> -r <string> -f <string> [-u <string>] [--apiversion <string>] [--json] [--loglevel trace|debug|info|warn|error|fatal|TRACE|DEBUG|INFO|WARN|ERROR|FATAL]
USAGE
  $ sfdx sfci:coverage -i <string> -r <string> -f <string> [-u <string>] [--apiversion <string>] [--json] [--loglevel
  trace|debug|info|warn|error|fatal|TRACE|DEBUG|INFO|WARN|ERROR|FATAL]

OPTIONS
  -f, --outputfile=outputfile                                                       (required) Output file for the
                                                                                    generated report

  -i, --id=id                                                                       (required) name to print

  -r, --result=result                                                               (required) Result format (cobertura
                                                                                    | jacoco)

  -u, --targetusername=targetusername                                               username or alias for the target
                                                                                    org; overrides default target org

  --apiversion=apiversion                                                           override the api version used for
                                                                                    api requests made by this command

  --json                                                                            format output as json

  --loglevel=(trace|debug|info|warn|error|fatal|TRACE|DEBUG|INFO|WARN|ERROR|FATAL)  [default: warn] logging level for
                                                                                    this command invocation
See code: src/commands/sfci/coverage.ts
sfdx sfci:report -f <string> [-i <string>] [-u <string>] [--apiversion <string>] [--json] [--loglevel trace|debug|info|warn|error|fatal|TRACE|DEBUG|INFO|WARN|ERROR|FATAL]
USAGE
  $ sfdx sfci:report -f <string> [-i <string>] [-u <string>] [--apiversion <string>] [--json] [--loglevel
  trace|debug|info|warn|error|fatal|TRACE|DEBUG|INFO|WARN|ERROR|FATAL]

OPTIONS
  -f, --outputfile=outputfile                                                       (required) Output file for the
                                                                                    generated report

  -i, --id=id                                                                       name to print

  -u, --targetusername=targetusername                                               username or alias for the target
                                                                                    org; overrides default target org

  --apiversion=apiversion                                                           override the api version used for
                                                                                    api requests made by this command

  --json                                                                            format output as json

  --loglevel=(trace|debug|info|warn|error|fatal|TRACE|DEBUG|INFO|WARN|ERROR|FATAL)  [default: warn] logging level for
                                                                                    this command invocation
See code: src/commands/sfci/report.ts
Debugging your plugin
We recommend using the Visual Studio Code (VS Code) IDE for your plugin development. Included in the .vscode directory of this plugin is a launch.json config file, which allows you to attach a debugger to the node process when running your commands.
To debug the hello:org command:
- Start the inspector
If you linked your plugin to the sfdx cli, call your command with the dev-suspend switch:
$ sfdx hello:org -u myOrg@example.com --dev-suspendAlternatively, to call your command using the bin/run script, set the NODE_OPTIONS environment variable to --inspect-brk when starting the debugger:
$ NODE_OPTIONS=--inspect-brk bin/run hello:org -u myOrg@example.com- Set some breakpoints in your command code
- Click on the Debug icon in the Activity Bar on the side of VS Code to open up the Debug view.
- In the upper left hand corner of VS Code, verify that the "Attach to Remote" launch configuration has been chosen.
- Hit the green play button to the left of the "Attach to Remote" launch configuration window. The debugger should now be suspended on the first line of the program.
- Hit the green play button at the top middle of VS Code (this play button will be to the right of the play button that you clicked in step #5).
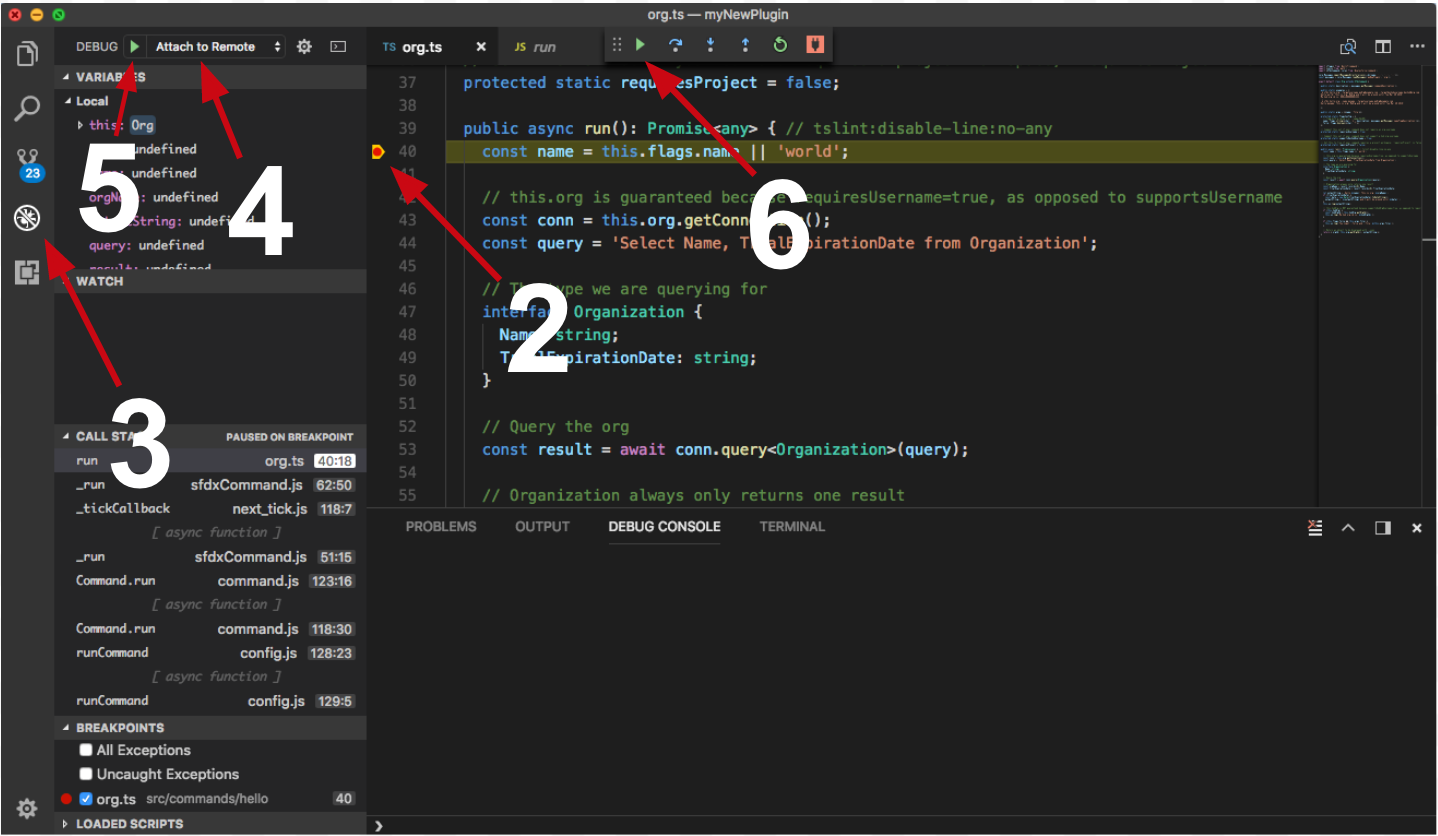
Congrats, you are debugging!
