
RadarChart
A radar chart to generate an overview of your roadmap or tech radar.

- Arranges your items (e.g. initiatives) on a Pie view:
- high level grouping (e.g. goals) => slices
- optional sub grouping (eg. outcomes) => subSlices
- your timescale/ring classification (eg. Now/Next/Later, Q1/Q2/Q3/Q4, adopt/trial/asses/hold etc.) => rings
- Generates tooltips for each item
- Reads data from CSV, Google sheet (via CSV publish) or JSON. Get in touch if you need a different source for your use case (eg. Trello, Jira etc.)
- Customizable:
Examples
Tech radar
ThoughtWorks Technology Radar vol 23 - notice that sub-slices are optional.

ThoughtWorks' original tech radar layout is better for this use case but less generic (e.g fixed 4 slices and 4 rings, no sub-slices etc.).
Using it with your data
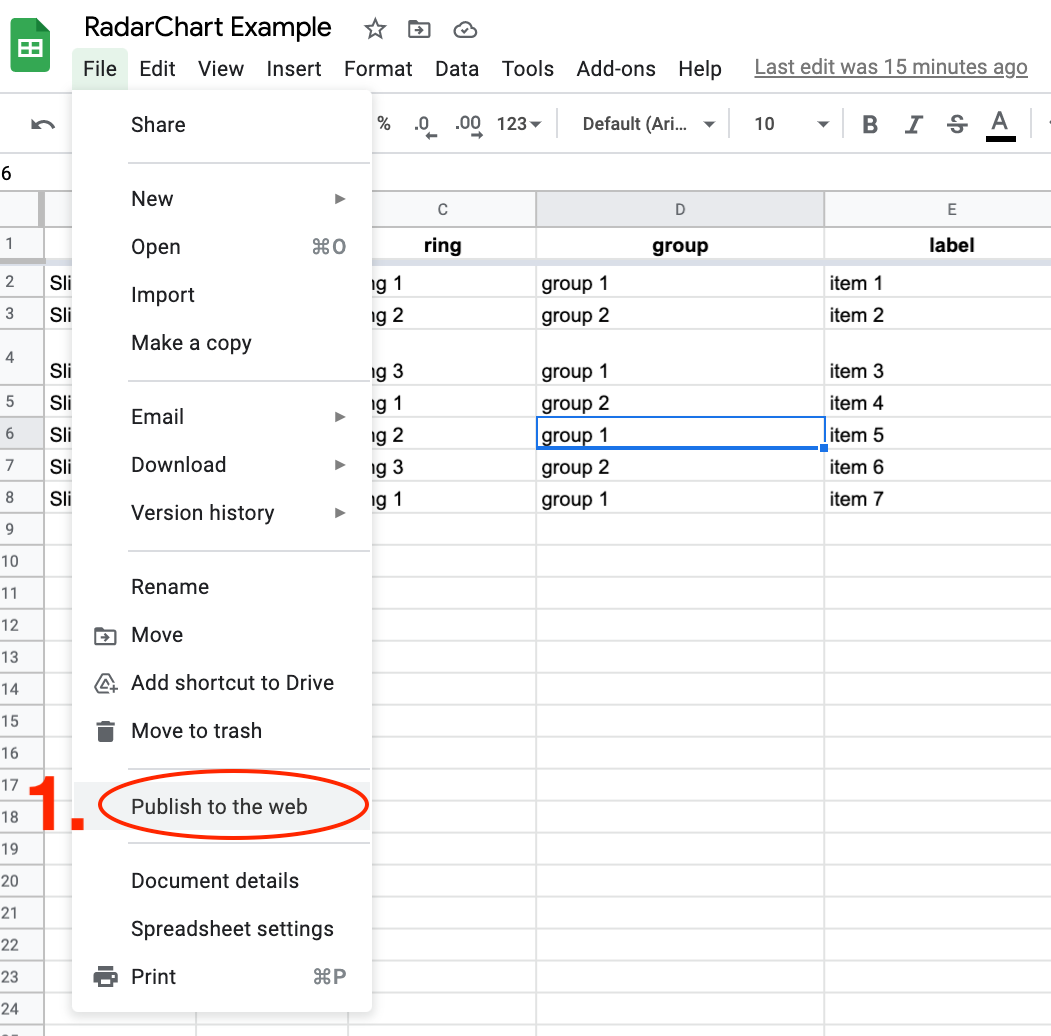
The simplest way to add data is via a google spreadsheet:
-
Save a copy of this spreadsheet
Note: sheet columns (watch out for the capitalization):
slice, [subSlice], ring, group, label, [description]
-
Add your items one per row
Tips:
- rings will be displayed in the order of appearance in the sheet. I.e. the ring of the first item in the spreadsheet will be the innermost ring.
- subSlice is optional , you can have single level grouping
- The order of slices and sub slices are conserved.
- Item colours are based on their group. Colors are assigned to d3.schemeSet1 color scheme in the order of their appearance. I.e. first group appearing will be red by default. You can customize the colorscheme. See an example in Example.ts
-
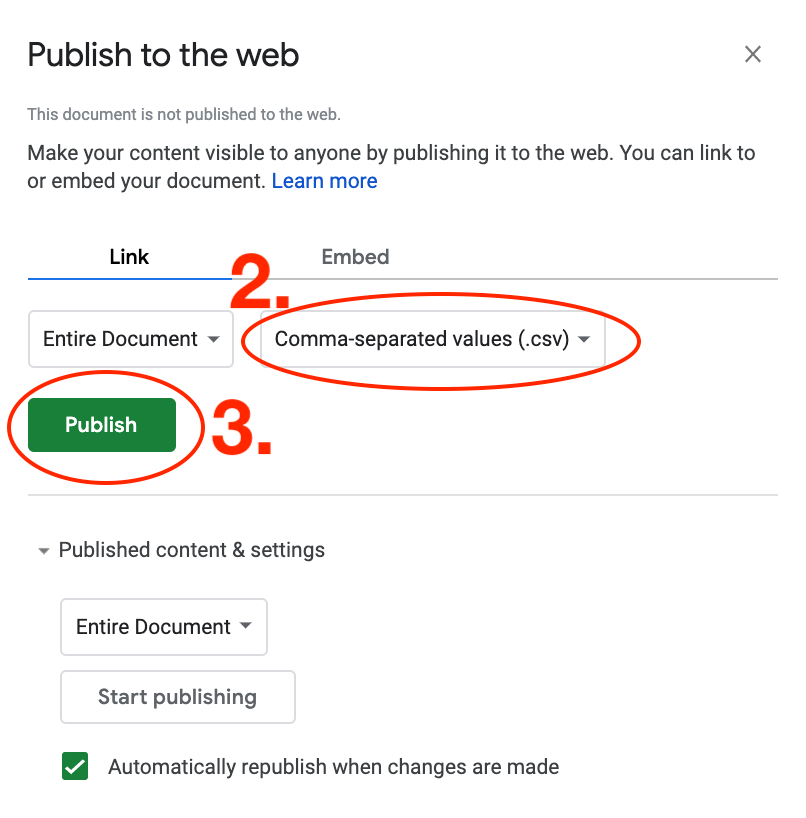
Publish the sheet as CSV and copy the link
-
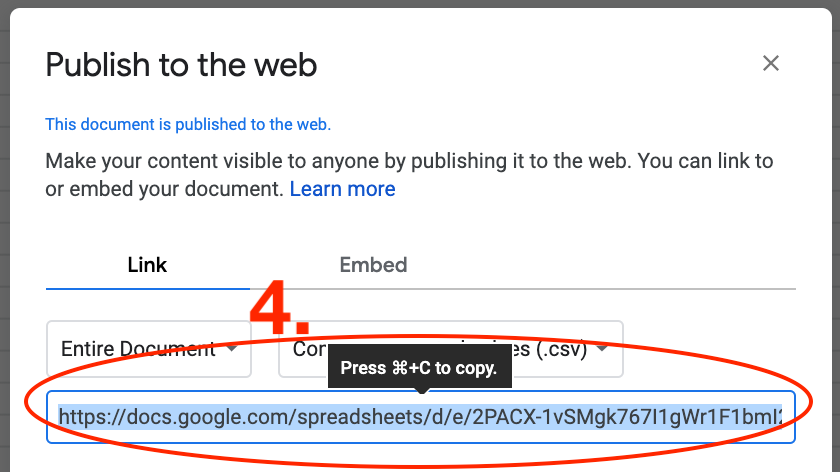
Add the link as
csvurl parameterhttps://radarchart.netlify.app/?csv=<your link>It should look something like this:
Note: Radar Chart will reflect changes in your google sheet after reload. Published google sheets take sometime to reflect the changes just be patient and keep reloading.


Customizing
Tooltips

Tooltip layout is configurable in style.css
Sub-slice sizing: equal vs. proportional
Sub-slices are sized equally by default so it's apparent when some sub-slices have much less items than others.
If you have too many items in some sub slices compered to other sub-slices then you might want to allow proportional sub slice sizing with radarConfig.pie.minSubSliceAngle

Ring sizing: equal vs. proportional
Rings are sized proportional to the number of items in each ring by default. You can adjust the minimum ring radius with radarConfig.pie.minRingRadius
If you want the rings to have equal sizes then set minRingRadius to a number which is higher than the total radius.

Usage in your code
For more details (eg. RadarConfig tips, error handling etc.) see index.ts
yarn add roadmap-radar-chartimport "roadmap-radar-chart/style.css";
import { SingleDsvDataSource, RadarContainer } from "roadmap-radar-chart";
const CSV_URI =
"https://docs.google.com/spreadsheets/d/e/2PACX-1vSMgk767I1gWr1F1bmI2XMttvPa1TyXcdd910BSfQZjqIvOHA_aE_ESnAhftTmjnJ-KL5uwPr-LIRYJ/pub?output=csv";
const svgDiv = document.getElementById("myRadar-div");
//////////////////////////////////////////////////////////////////////////
// Setup data source.
const radarDs = new SingleDsvDataSource(CSV_URI);
//////////////////////////////////////////////////////////////////////////
// Creating the chart with default configs. Customize it by passing a RadarConfig object
const radarContainer = new RadarContainer();
//////////////////////////////////////////////////////////////////////////
// Fetch data and append it to svg
radarContainer.fetchData(radarDs).then(() => {
radarContainer.appendTo(svgDiv);
});<!DOCTYPE html>
<html lang="en">
<head>
<meta charset="UTF-8" />
<meta name="viewport" content="width=device-width, initial-scale=1" />
<title>Roadmap Radar</title>
</head>
<body>
<div class="error-div"></div>
<div id="myRadar-div" class="radar-div"></div>
<div id="myRadar-tooltip" class="radar-tooltip"></div>
</body>
</html>License
This project is licensed under the MIT license. See the LICENSE file for details.