A Javascript Developer Friendly Console / Debugger.
I have always been annoyed of the console.log not being practical enough, and the debugger "too slow". So i made Recompyle to fix that, it also solves multiple frictions of the debugging experience.
- Need to write console.log everywhere, then remove them.
- The console.log does not have the scope like a breakpoint in the debugger.
- When you click on a file path in chrome it opens in the dev console not in the IDE.
- A better log history than "Preserve Log"
Recompyle will not work for every project right now. It's a work in progress.
Example of Open Source projects that work with Recompyle :
https://github.com/sahat/hackathon-starter ( Node + Browser)
https://github.com/jgudo/ecommerce-react ( Browser )
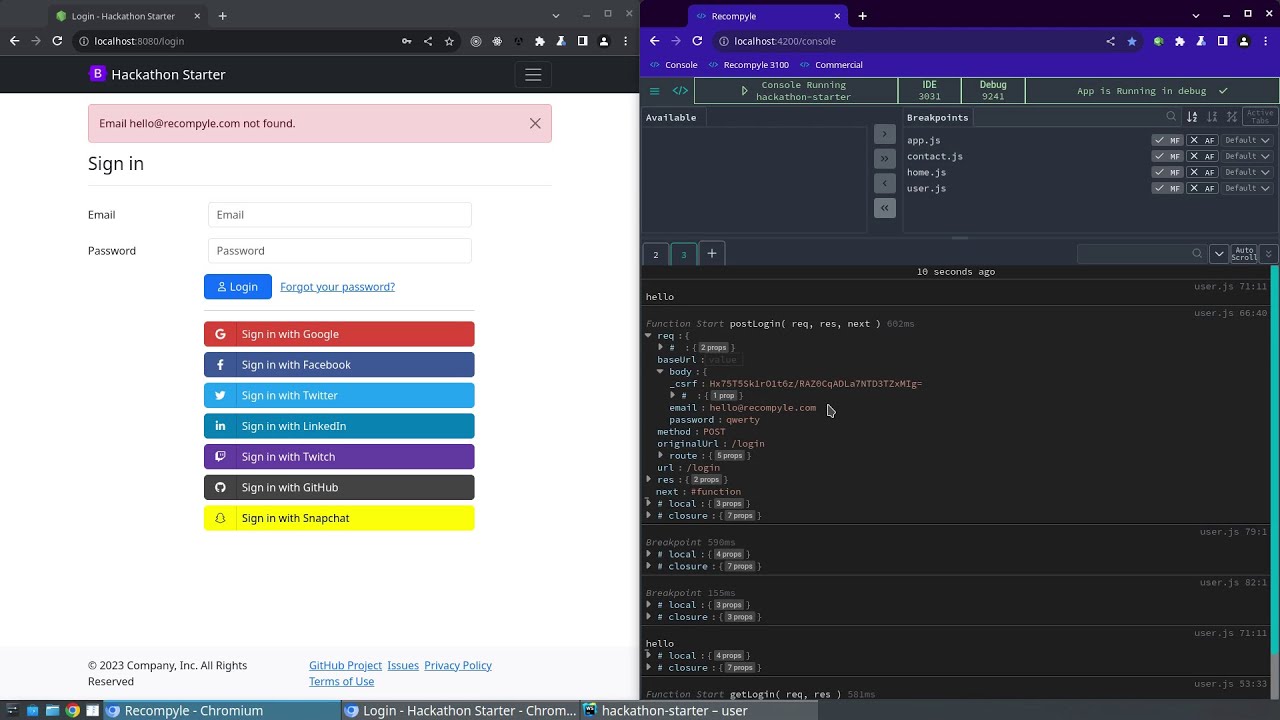
An example of code :

What it look like in Recompyle :
It parse you project & files, connect to your app with the debugger api, set breakpoints, pause at X breakpoints, query the state, resume the breakpoint. Kind of a mix of the debugger and the console + some parsing.
- A Node.js or Browser App built with Javascript or Typescript.
- The Source Maps enabled ( it's generally enabled by default in development )
- Create an account on Recompyle recompyle.com/signup ( 7 day free trial )
- Install recompyle globally
- npm install -g recompyle
- Install the plugin for your IDE :
- Start your App in debug
- in node.js :
- node app.js --inspect=9227
- With Nodemon + Typescript
- create a file nodemon.json
- {exec : "node --inspect=9230 -r ts-node/register server/app.ts}
- In the browser :
- On Chrome
- Linux
- chrome --remote-debugging-port=9227 --user-data-dir=/home/hello/chrome-profile
- flatpak run org.chromium.Chromium --remote-debugging-port=9227 --user-data-dir=/home/hello/chrome-profile
- Mac
- /Applications/Google\ Chrome.app/Contents/MacOS/Google\ Chrome --remote-debugging-port=9227 --user-data-dir=/Users/hello/chrome-profile
- Windows
- start chrome --remote-debugging-port=9227 --user-data-dir=/Users/hello/chrome-profile
- Linux
- On Chrome
- in node.js :
- Select a file with your IDE
- On jetbrains you have an Icon in the top right
or Tools > Recompyle > Select FIle
- On VsCode Command Palette ( CTRL + Shift + P ) > "Select File Recompyle"
- On jetbrains you have an Icon in the top right

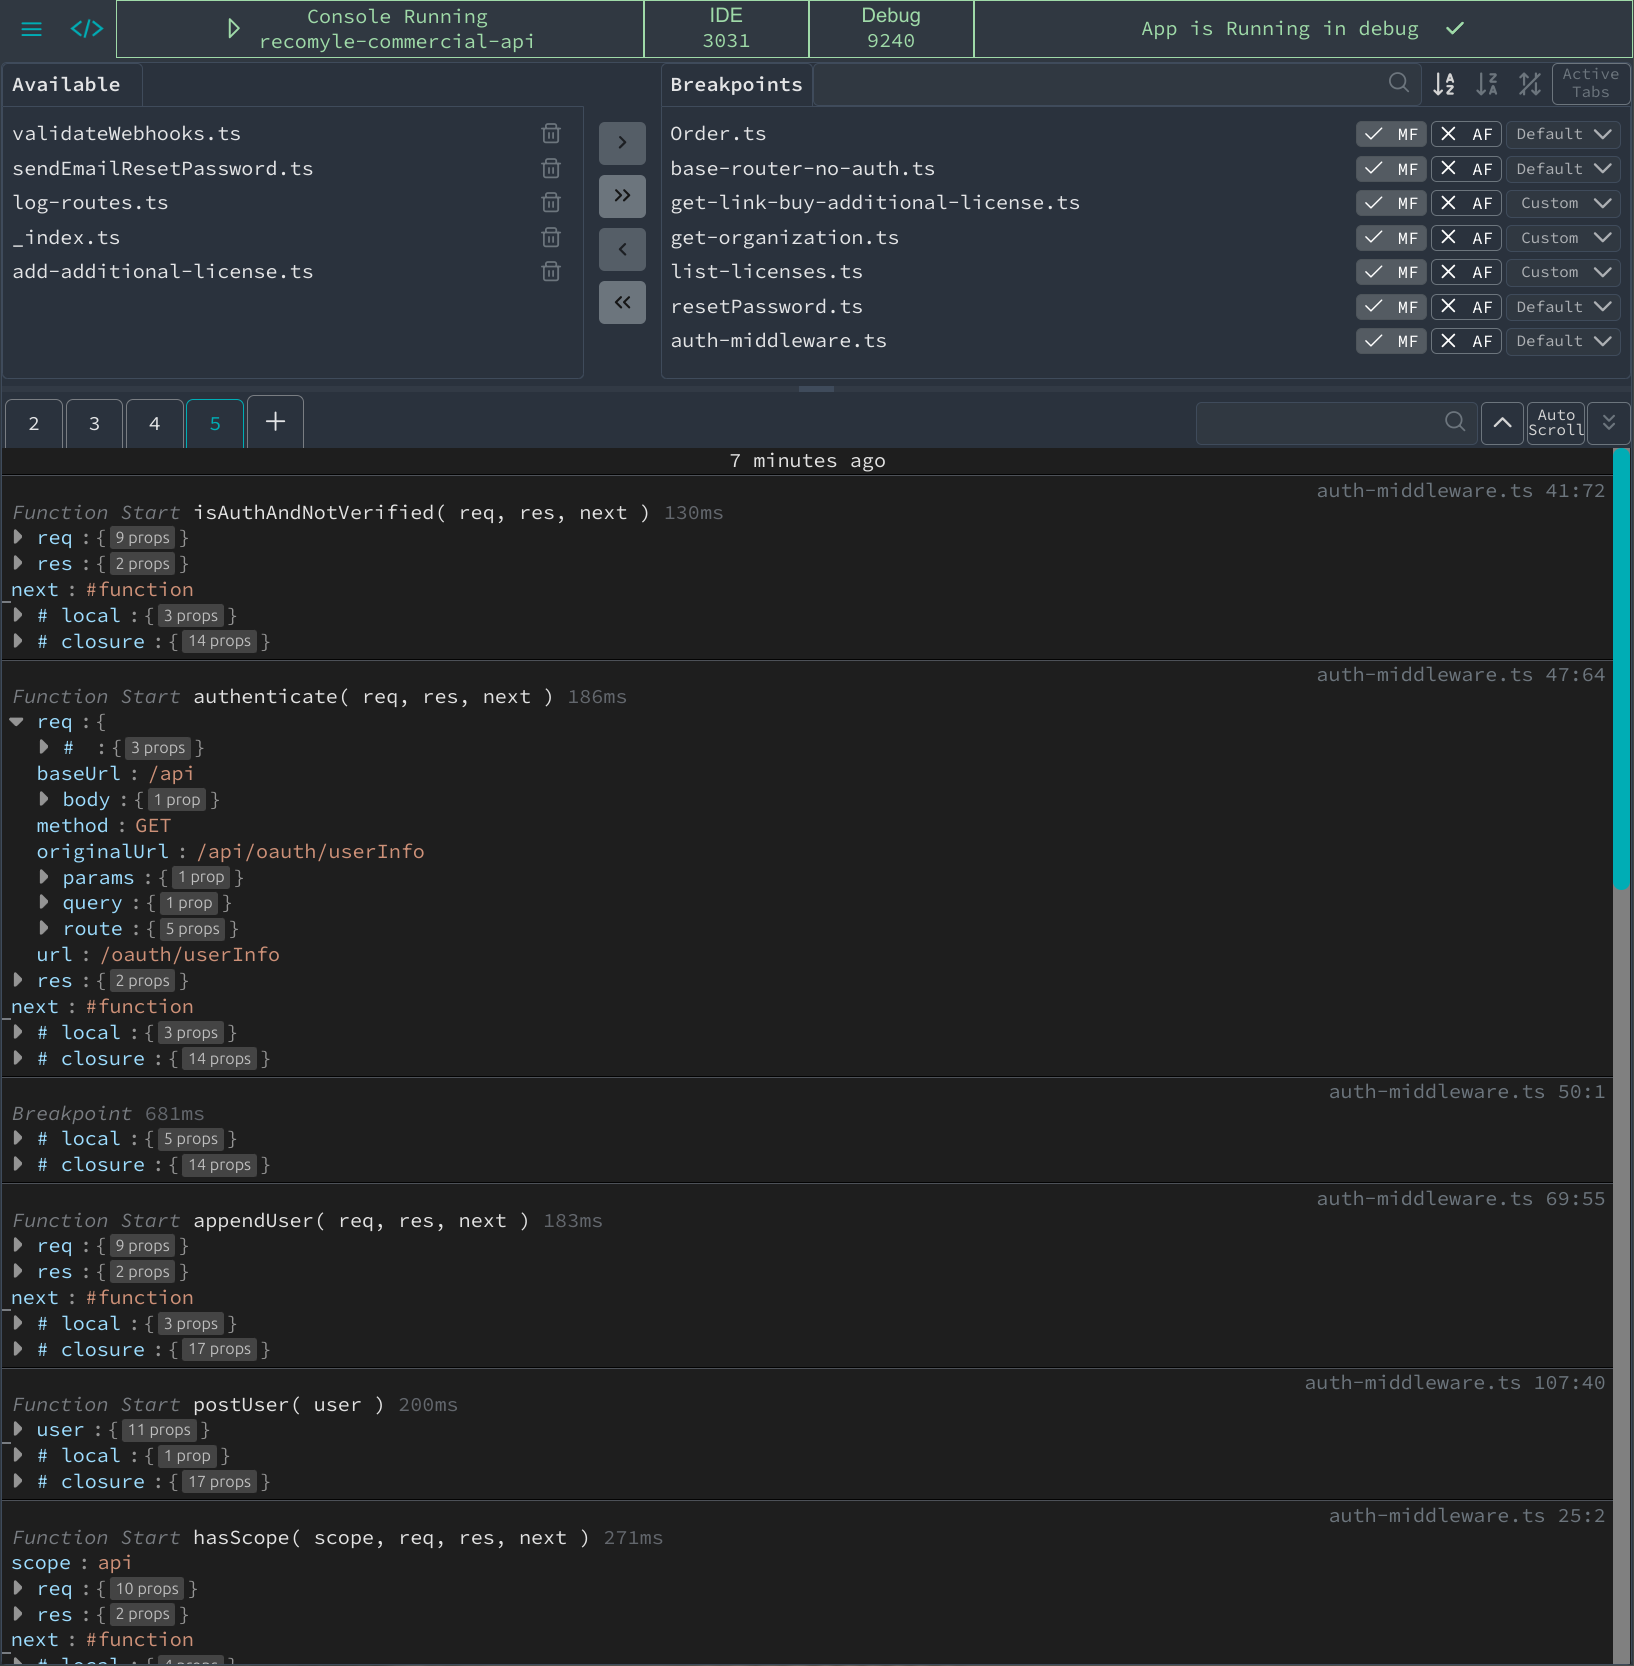
When the header is all green you are ready to go.
- 1 - show project name (name in package.json) selected + pause / resume recomyple
- 2 - The port used to connect with you IDE, can be changed in config.js > app.websocketPort
- 3 - the debug port used to connect to you app, click on it to change it.
- 4 - let you know what's going on
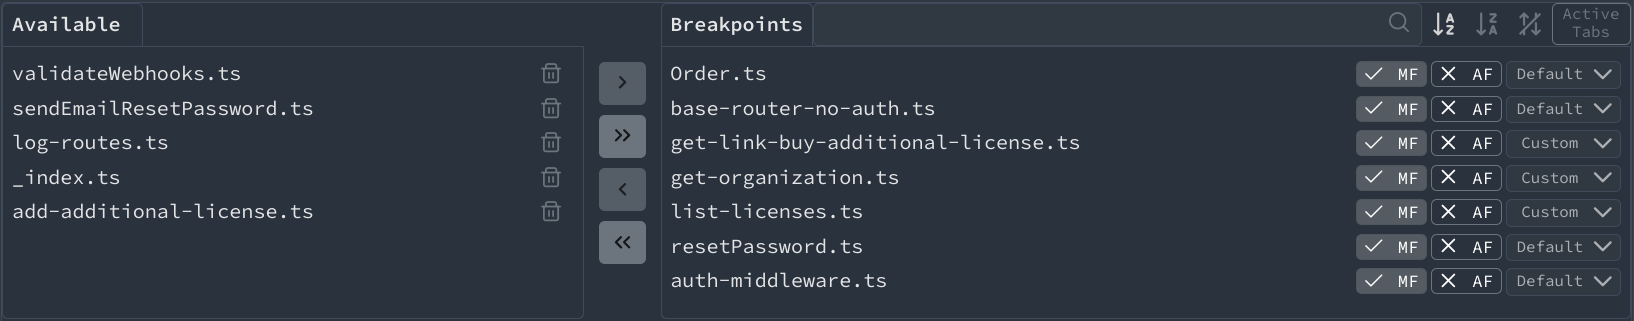
"Breakpoints" are the files that will log more informations :
- will log "Function Start isAuth( req, res, next ) 238ms" + the scope.
- will log the scope when you have a console.log.
- will log the breakpoints in your IDE.
"Available" is a back pocket of your files
All files opened in your IDE are added to "Breakpoints"
Some explanation about MF, AF, Default ;
- MF = Main Functions = will logs all the first level functions.
- AF = ALL Functions = will logs all functions
- Default / Custom : Open a popup that let you select what you want to log.

- Right click on tabs to delete old tabs
- Search bar for logs
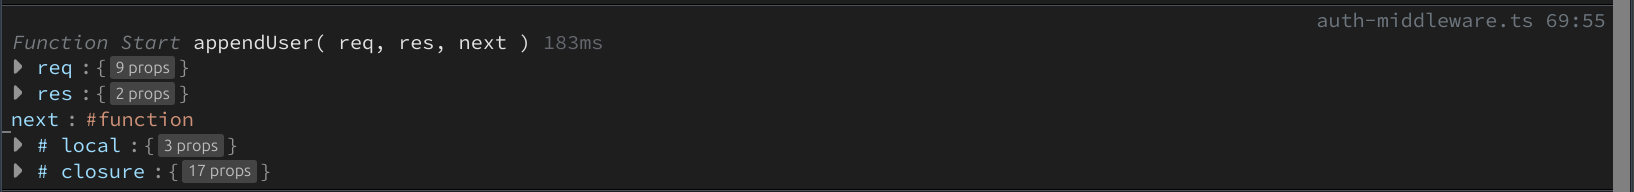
- Pretty formatting : show parameters + scope
- In the JSON viewer
- Right click on nodes to copy keys / values.
- Ctrl + Left Click to expand fully a node.
- on the file name on the left :
- Right click : Open the file in your IDE
- Left click : Add / Remove file from "Breakpoints"
Once you have selected a file in your IDE, recompyle will create a folder in you project ./recompyle/ inside there will be a
-
config.js : to change the ports and other apps settings, the settings are explained in the file. some more detailed explanation for the most important settings
- scope.timeout (300ms by default): The timeout to query an object in ms will show RecompyleMaxTimeout = true if the querying the data takes more that the timeout value. Increasing the timeout will make recompyle slower at each breakpoint. If you need some data that is not showing, increase the timeout as needed, then use the file data-filter.js to query only the data needed.
-
data-filter.js : let you customize filter the data from the scope. it takes time to query objects, by keeping only what you need it get faster.
-
the "#" with extras infos (scope.showHashtagInfos)
- className
- subType : show the subtype for some objects
- ignored : the ignored keys from data-filter.js

You can start multiple instances of recompyle if you need to.
7 day free trial, then 30€ + tax / user / year.
Yes you need an account to use recompyle.
The account is used to validate the license. Nothing more.
The only thing send to our server is a hash of your "machineId" (https://www.npmjs.com/package/node-machine-id)
The App run on you computer, your code is private and not send to our servers.
No analytics or error tracking.
Preferably on Github issues. Or by email support@recompyle.com
- Make it work on all projects.
- Show the result of Promise, Await, Callback, Subscription.
- Call method to get the data : right now recompyle log only values, it will be possible to call a method and log the result. it would be a configuration in data-filter.js ( callMethod : [string] )
- Make Recompyle work with testing framework.
- Log network requests.
- ???