reactjs-graphs

1.4.0 • Public • Published

ReactJS Graphs

A simple react component to draw branched graphs consisting of vertices and edges.

How To Use?

  1. Install using npm install reactjs-graphs --save
  2. Import in your react project: import Graph from 'reactjs-graphs'
  3. Use directly in render function. Here's an example explaining all possible props you can pass:
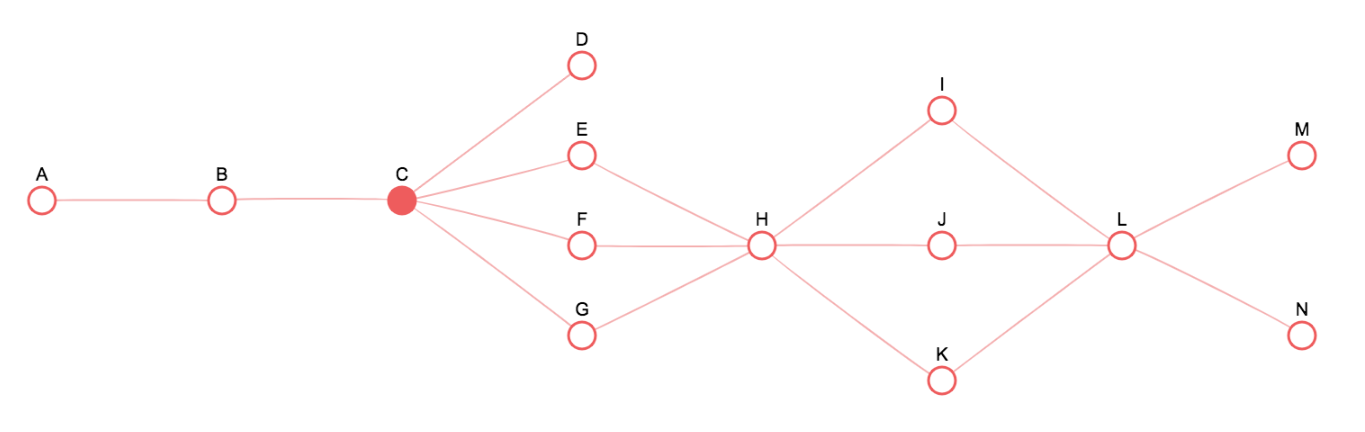
import React from 'react'
import ReactDOM from 'react-dom'
import Graph from 'reactjs-graphs'
 
const onClick = (label, index, extras) => {
    console.log(label, index, extras)
}
 
const vertices = [
    { label: "A", onClick },
    { label: "B", onClick },
    { label: "C", onClick },
    { label: "D", onClick },
    { label: "E", onClick },
    { label: "F", onClick },
    { label: "G", onClick },
    { label: "H", },
    { label: "I", },
    { label: "J", },
    { label: "K", },
    { label: "L", },
    { label: "M", },
    { label: "N", },
]
 
const edges = [
    ["A", "B"],
    ["B", "C"],
    ["C", "D"],
    ["C", "E"],
    ["C", "F"],
    ["C", "G"],
    ["F", "H"],
    ["E", "H"],
    ["G", "H"],
    ["H", "I"],
    ["H", "J"],
    ["H", "K"],
    ["K", "L"],
    ["J", "L"],
    ["I", "L"],
    ["L", "M"],
    ["L", "N"]
]
 
 
ReactDOM.render(<Graph 
    vertices={vertices} // vertices array
    edges={edges} // edges array
    width={window.innerWidth} // width of canvas
    height={500} // height of canvas
    autoWidth={true} // automatically sets width of canvas using width of graph
    vertexStroke="#df6766" // color of vertex border
    edgeStroke="#ebb2b2" // color of edge 
    edgeWidth={2} // thickness of edge
    vertexRadius={15} // radius of vertex
    vertexGap={200} // gap between vertices
    labelFontSize={20} // font size of labels
    activeVertexFill="blue" // color of vertex when hovered
    inactiveVertexFill="white" // color of vertex when not hovered
    fontFamily="Airbnb Cereal" // name of font
    labelColor="black" // color of label
    className="className" // class name given to canvas parent
    centerInCanvas={true} // centers the whole graph horizontally and vertically
/>, document.getElementById('root'))
  1. The example above would render the following graph:

Demo

Package Sidebar

Install

npm i reactjs-graphs

Weekly Downloads

1

Version

1.4.0

License

MIT

Unpacked Size

267 kB

Total Files

4

Last publish

Collaborators

  • mehulmpt