ps-web-perf-library
This is a tiny library for exporting web performance statistics from Performance API of a browser into Elasticsearch and Kibana.
Why
A browser can tell you a lot of information about web performance through its Performance API. But a typical setup is that you lose out on all these pieces of information because you do not gather them. However, with this library, you can collect and send performance entries to Elasticsearch and display them in Kibana.
Installation
Nothing special here, just use npm:
$ npm install ps-web-perf-library
or yarn:
$ yarn add ps-web-perf-library
Use samanpavel/ps-elastic-stack-setup Docker image to set up Elastic stack:
$ docker run -it --rm \
--env ELASTICURL=https://web-perf-xxxxxx.es.eu-central-1.aws.cloud.es.io \
--env ELASTICPORT=9243 \
--env ELASTICUSER=elastic \
--env ELASTICPASSWORD=mysecretpwd \
--env KIBANAURL=https://web-perf-xxxxxx.kb.eu-central-1.aws.cloud.es.io \
--env KIBANAPORT=9243 \
--env KIBANAUSER=elastic \
--env KIBANAPASSWORD=mysecretpwd \
samanpavel/ps-elastic-stack-setup
Usage
Typically, you want to use it along with some test framework like WDIO or Puppeteer.
The library needs Elastic credentials, you can prepare a .env file where your set them up:
ELASTICURL=
ELASTICPORT=
ELASTICUSER=
ELASTICPASSWORD=
An example how to use the library in code could be the following check where you navigate to a homepage:
require('dotenv').config();
const { exportWebPerfStats } = require('ps-web-perf-library');

it('Open homepage', async () => {
  await browser
    .url(browser.config.baseUrl);

  await expect('#menu')
    .toBeDisplayedInViewport();

  const perfEntries = await browser.execute(() => {
    return window.performance.getEntries();
  });

  await exportWebPerfStats(perfEntries);
});
Or a brief example in Puppeteer:
require('dotenv').config();
const { exportWebPerfStats } = require('ps-web-perf-library');

const perfEntries = await page.evaluate(() => performance.getEntries());
await exportWebPerfStats(perfEntries);
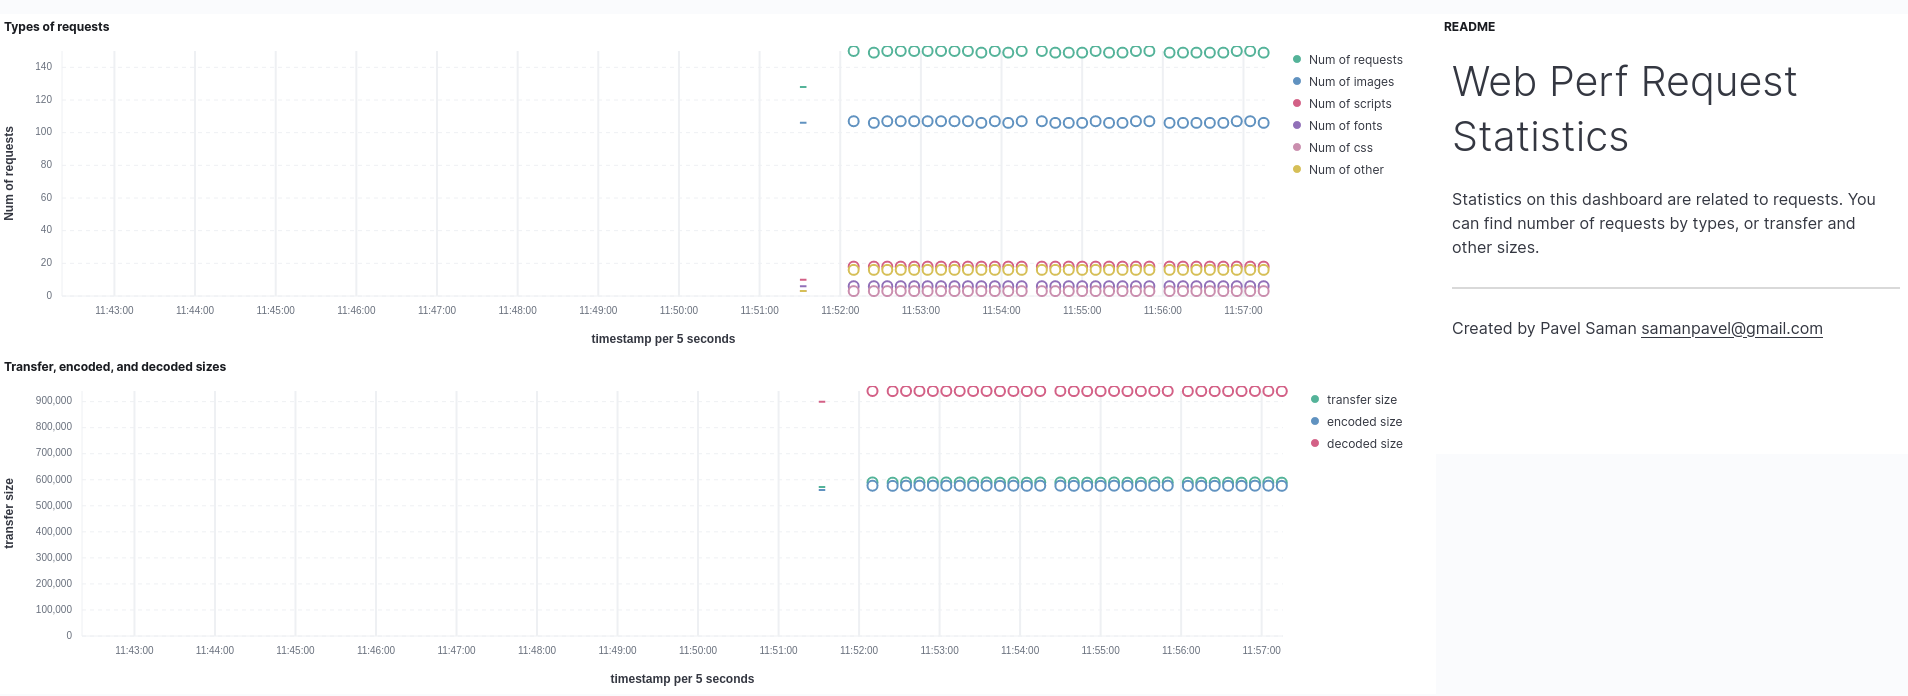
Performance statistics from performance.getEntries() method will end up in Elasticsearch, and will be displayed on Kibana dashboards.
If you want to disable sending statistics into Elastic stack, set up environment variable NOSTATS to true.
I also recommend running a standalone Chrome in a Docker container, e.g.:
$ docker run -d -p 4444:4444 --shm-size="2g" \
selenium/standalone-chrome:4.1.0-20211123
More on that here.
Kibana dashboards
There are two dashboards in Kibana:

