

You can also load directly from UNPKG as a standalone library.
<script src="https://unpkg.com/@finos/perspective@0.6.2/dist/umd/perspective.js"></script>
<script src="https://unpkg.com/@finos/perspective-viewer@0.6.2/dist/umd/perspective-viewer.js"></script>
<script src="https://unpkg.com/@finos/perspective-viewer-datagrid@0.6.2/dist/umd/perspective-viewer-datagrid.js"></script>
<script src="https://unpkg.com/@finos/perspective-viewer-d3fc@0.6.2/dist/umd/perspective-viewer-d3fc.js"></script>
<script src="https://unpkg.com/perspective-map@1.0.1/dist/index.js"></script>
As a module with NPM or YARN
# npm
npm i perspective-leaflet --save-dev

# yarn
yarn add perspective-leaflet
And then import it:
import perspective from "@finos/perspective";
import "@finos/perspective-viewer";
import "@finos/perspective-viewer-datagrid";
import "@finos/perspective-viewer-d3fc";
import "@finos/perspective-viewer/themes/all-themes.css";
import "perspective-map";The plugin has been tested with the latest versions of Perspective (>= 0.8.0) which was released on 28.04.2021.
You will also need to include the Leaflet CSS
<link rel="stylesheet" href="https://unpkg.com/leaflet@1.7.1/dist/leaflet.css" />Or
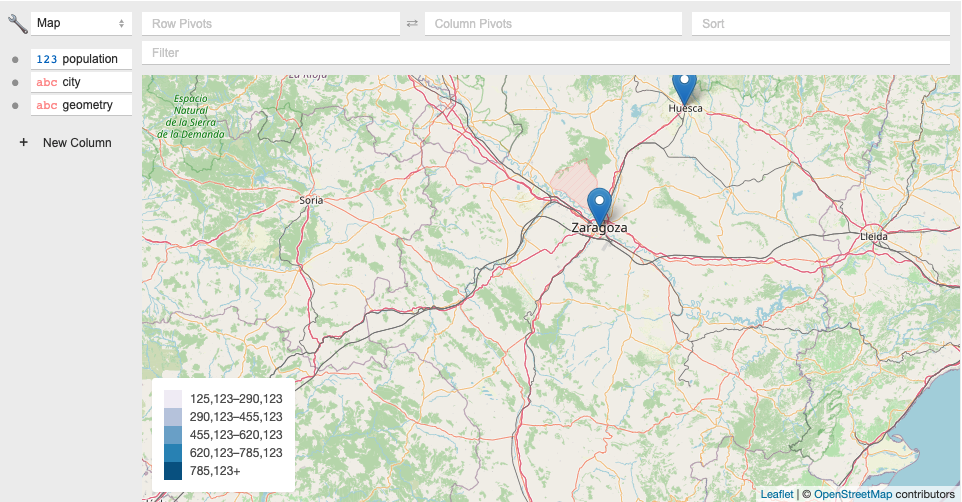
import "leaflet/dist/leaflet.css";The plugin expects to receive the data as CSV, and it should have a column called geometry, which will have the geospatial data in GeoJSON or TopoJSON format (string-like).
An example:
population,city,geometry
785123,"Zaragoza","{""type"":""Point"",""coordinates"":[-0.8850860595703125,41.64828831259533]}"
125123,"Teruel","{""type"":""Point"",""coordinates"":[-1.1061859130859375,40.345497469392406]}"
785123,"Huesca","{""type"":""Point"",""coordinates"":[-0.41473388671875,42.14202329789122]}"
You can choose the metric and zoom value of the map with the `map-config. This attribute is optional.
Create an object
const configMap = {
  metric: "population",
  zoom: true
}
metric: string This is the column of data used to color the map and display it in the legend. If not defined, the map uses the first value of the data.
zoom: boolean, enable/disable the zoom of the map.
Stringify the object to add it as an attribute to the perspective-viewer.
const element = document.getElementsByTagName("perspective-viewer")[0];
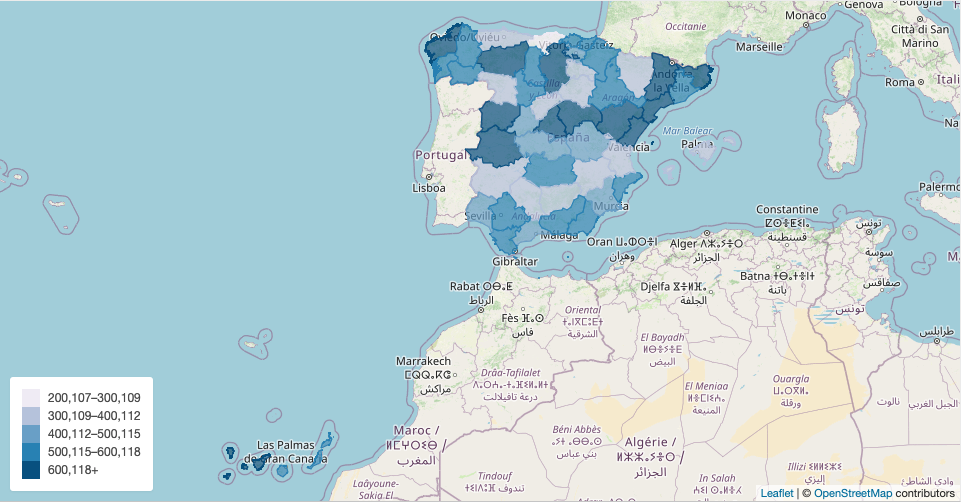
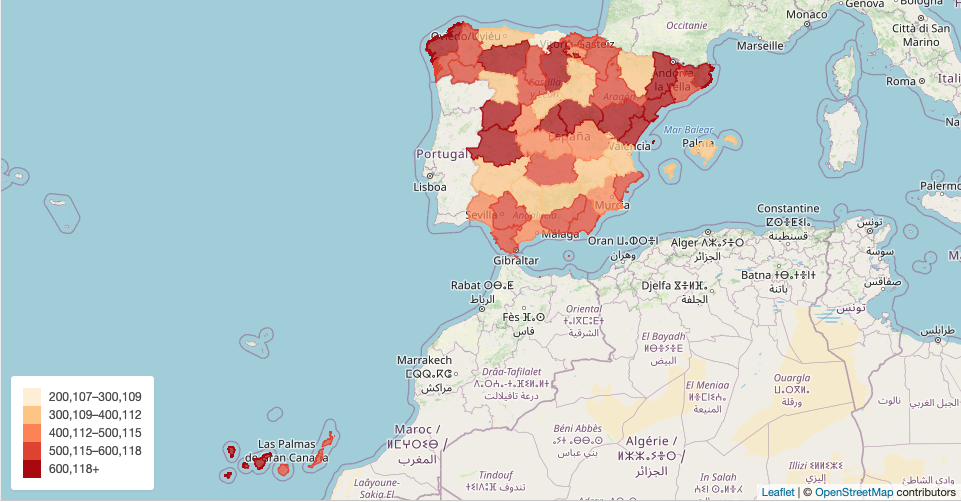
element.setAttribute("config-map", JSON.stringify(configMap))You can override the color scale using custom properties. To create color scales for maps, we recommend using ColorBrewer
In your CSS, you should override the custom properties that we have created.
:root {
  --perspective-map-range-1: #fef0d9;
  --perspective-map-range-2: #fdcc8a;
  --perspective-map-range-3: #fc8d59;
  --perspective-map-range-4: #e34a33;
  --perspective-map-range-5: #b30000;
  --perspective-map-category-1: #feebe2;
  --perspective-map-category-2: #fbb4b9;
  --perspective-map-category-3: #f768a1;
  --perspective-map-category-4: #c51b8a;
  --perspective-map-category-5: #7a0177;
}
- Clone the repo
- Install dependencies
- Start coding!
- Send a PR