
A Node-RED node to provide a world map web page for plotting "things" on.
Feel free to 
-
v4.6.5 - Let geojson allow for generic overrides with .icon and .layer.
-
v4.6.4 - Fix deletion of layers logic to actually fully remove points.
-
v4.6.3 - Fix sending of layer events when not wanted. Issue #262
-
v4.6.2 - Fix multiple use of contextmenu feedback. Issue #259
-
v4.6.1 - Let default pmtiles be light/dark or monocolored.
-
v4.5.2 - Tidy up when pmtiles removed.
-
v4.5.0 - Fix pmtiles to look for maps in userdir rather than modules
-
v4.4.0 - Add quad(copter) drone icon.
-
v4.3.3 - Fix for objects changing layers.
-
v4.3.2 - Fix geojson popup missing label name.
-
v4.3.1 - Small fix to icon transparency, and routing detail.
-
v4.3.0 - Add support for PMtiles files.
-
v4.2.1 - Revert use of optional chaining to extend life slightly. Issue #252
-
v4.2.0 - Let icons also be inline images data:image...
-
v4.1.0 - Add optional SOG, COG, altft, altm input properties.
-
v4.0.0 - Breaking - Better context menu variable substitution and retention Now uses ${name} syntax rather than $name so we can handle user defined variables in context menus.
-
v3.2.0 - Sync up drawing sessions across browsers to same map
-
v3.1.0 - Add esri overlay layers, and let geojson overlay rendering be customised
-
v3.0.0 - Bump to Leaflet 1.9.4 Breaking - Move to geoman for drawing shapes. Allow command.rotation to set rotation of map. Allow editing of multipoint geojson tracks.
-
see CHANGELOG for full list of changes.
Either use the Manage Palette option in the Node-RED Editor menu, or run the following command in your Node-RED user directory - typically ~/.node-red
npm i node-red-contrib-web-worldmap
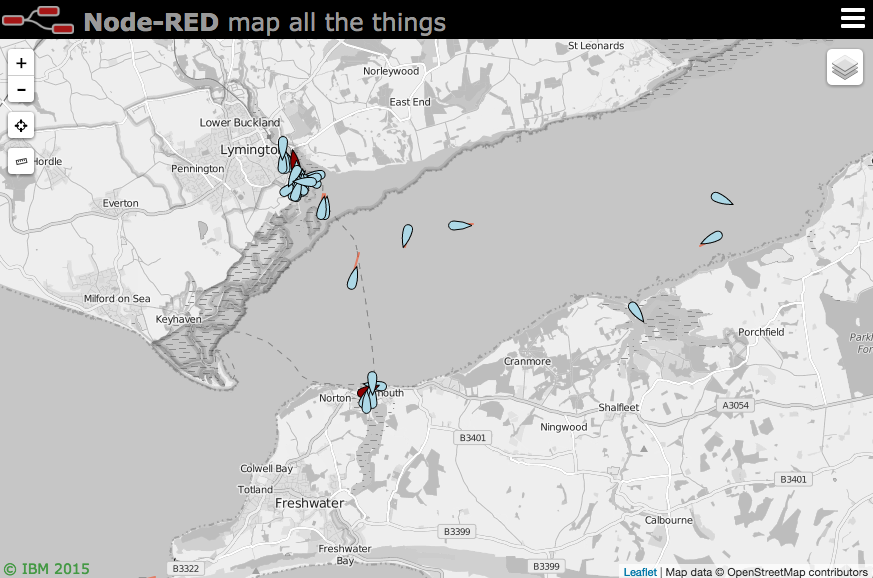
Plots "things" on a map. By default the map will be served from {httpRoot}/worldmap, but this
can be changed in the configuration panel.
Use keyboard shortcut ⌘⇧m, ctrl-shift-m to jump to the map.
The minimum msg.payload must contain name, lat and lon properties, for example
msg.payload = { "name":"Jason", "lat":51.05, "lon":-1.35 }
name must be a unique identifier across the whole map. Repeated location updates to the same name move the marker.
Optional properties for msg.payload include
- deleted : set to true to remove the named marker. (default false)
- draggable : set to true to allow marker to be moved by the mouse. (default false)
- layer : specify a layer on the map to add marker to. (default "unknown")
- track | hdg | heading | COG | bearing : when combined with speed, draws a vector. (only first will be used)
- speed : when combined with track, hdg, heading, or bearing, draws a leader line vector - should be in m/s. Can also be specified as "20 kph", or "20 mph", or "20 kt". i.e a string with units.
- SOG : speed over ground - speed in knots.
- alt | altitude | altft | altm : Altitude in meters, but can use altft to specify feet instead.
- accuracy : when combined with heading vector, draws an arc of possible direction.
- color : CSS color name or #rrggbb value for heading vector line or accuracy polygon.
- icon : font awesome icon name, weather-lite icon, :emoji name:, or https:// or inline data:image/ uri.
- iconColor : Standard CSS colour name or #rrggbb hex value.
- SIDC : NATO symbology code (can be used instead of icon). See below.
- building : OSMbulding GeoJSON feature set to add 2.5D buildings to buildings layer. See below.
- ttl : time to live, how long an individual marker stays on map in seconds (overrides general maxage setting, minimum 20 seconds)
- photoUrl : adds an image pointed at by the url to the popup box.
- videoUrl : adds an mp4 video pointed at by the url to the popup box. Ideally 320x240 in size.
-
weblink : adds a link to an external page. Either set a url as a string, or an object like
{"name":"BBC News", "url":"https://news.bbc.co.uk", "target":"_new"}, or multiple links with an array of objects[{"name":"BBC News", "url":"https://news.bbc.co.uk", "target":"_new"},{"name":"node-red", "url":"https://nodered.org", "target":"_new"}] - addtoheatmap : set to false to exclude point from contributing to the heatmap layer. (default true)
- intensity : set to a value of 0.1 - 1.0 to set the intensity of the point on the heatmap layer. (default 1.0)
- clickable : Default true. Setting to false disables showing any popup.
- popped : set to true to automatically open the popup info box, set to false to close it.
- popup : html to fill the popup if you don't want the automatic default of the properties list. Using this overrides photourl, videourl and weblink options.
- label : displays the contents as a permanent label next to the marker, or
- tooltip : displays the contents when you hover over the marker. (Mutually exclusive with label. Label has priority)
-
contextmenu : an html fragment to display on right click of marker - defaults to delete marker. You can specify
${name}to substitute in the name of the marker. Set to""to disable just this instance.
Any other msg.payload properties will be added to the icon popup text box. This can be
overridden by using the popup property to supply your own html content. If you use the
popup property it will completely replace the contents so photourl, videourl and weblink are meaningless in this mode.
You may select any of the Font Awesome set of icons.
If you use the name without the fa- prefix (eg male) you will get the icon inside a generic marker shape. If you use the fa- prefix (eg fa-male) you will get the icon on its own. Likewise you can use any of the Weather-lite icons by using the wi- prefix. These map to icons returned by common weather API such as DarkSky and OpenWeatherMap - for example "wi-owm-"+msg.payload.weather[0].icon will pickup the icon returned from the OpenWeatherMap API.
You can also specify an emoji as the icon by using the :emoji name: syntax - for example :smile:. Here is a list of emojis.
Or you can specify an image to load as an icon by setting the icon to http(s)://... By default it will be scaled to 32x32 pixels. You can change the size by setting iconSize to a number - eg 64. Example icon - "https://img.icons8.com/windows/32/000000/bird.png" or you can use an inline image of the form data:image/... which uses a base64 encoded image.
There are also several special icons...
- plane : a jet plane icon that aligns with the heading of travel.
- smallplane : a light aircraft icon that aligns with the heading of travel.
- ship : a ship icon that aligns with the heading of travel.
- car : a car icon that aligns with the heading of travel.
- bus : a bus/coach icon that aligns with the heading of travel.
- uav : a small drone uav like icon that aligns with the heading of travel.
- quad : a small quadcopter uav like icon that aligns with the heading of travel.
- helicopter : a small helicopter icon that aligns with the heading of travel.
- sensor : a camera icon that points to the heading angle.
- arrow : a map GPS arrow type pointer that aligns with the heading of travel.
- wind : a wind arrow that points in the direction the wind is coming FROM.
- satellite : a small satellite icon.
- iss : a slightly larger icon for the ISS.
- locate : a 4 corner outline to locate a point without obscuring it.
- friend : pseudo NATO style blue rectangle. (but see NATO SIDC option below)
- hostile : pseudo NATO style red circle.
- neutral : pseudo NATO style green square.
- unknown : pseudo NATO style yellow square.
-
earthquake : black circle - diameter proportional to
msg.mag.
You can use NATO symbols from milsymbol.js.
To do this you need to supply a msg.payload.SIDC 2525 code instead of an icon, for example:
msg.payload = {
    "name": "Emergency Medical Operation",
    "lat": 51.05,
    "lon": -1.35,
    "SIDC": "ENOPA-------",
    "options": { "fillOpacity":0.8, "additionalInformation":"Extra info" }
}
SIDC codes can be generated using the online tool - https://www.spatialillusions.com/unitgenerator-legacy/
There are lots of extra options you can specify as msg.payload.options - see the milsymbol docs here.
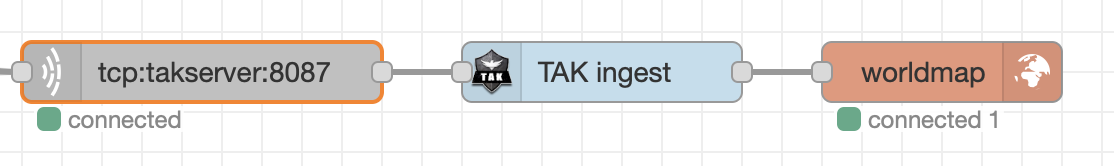
Users of TAK can use the TAK ingest node to create a JSON formatted TAK event object, received from a TAK server. This can be fed directly into the worldmap node.
If the msg.payload contains an area property - that is an array of co-ordinates, e.g.
msg.payload = {"name": "zone1", "area": [ [51.05, -0.08], [51.5, -1], [51.2, -0.047] ]}
then rather than draw a point and icon it draws the polygon. If the "area" array only has 2 elements, then it assumes this is a bounding box for a rectangle and draws a rectangle.
Likewise if it contains a line property it will draw the polyline.
If the payload also includes a property fit:true the map will zoom to fit the line or area. Alternatively you can use fly:true instead of fit for a more animated look.
Finally if a greatcircle property is set containing an array of two coordinates then an arc following the great circle between the two co-ordinates is plotted.
msg.payload = {name:"GC1", color:"#ff00ff", greatcircle:[ [51.464,0], [25.76,-80.18] ] }
Shapes can also have a popup property containing html, but you MUST also set a property clickable:true in order to allow it to be seen. You can also set tooltip to create a label that appears when you hover the mouse over the shape.
There are extra optional properties you can specify - see Options below.
If the msg.payload contains a radius property, as well as name, lat and lon, then rather than draw a point it will draw a circle. The radius property is specified in meters.
msg.payload = { "name":"A3090", "lat":51.05, "lon":-1.35, "radius":3000 }
As per Areas and Lines you may also specify color, fillColor, and layer, see Options section below.
msg.payload =  {
    "name": "circle",
    "lat": 51.515,
    "lon": -0.1235,
    "radius": 1000,
    "layer": "drawing",
    "iconColor": '#464646',
    "stroke": false,
    "fillOpacity": 0.8,
    "clickable": true
};
If the radius property is an array of two numbers, these specify the minor and major radii of an ellipse, in meters. A tilt property can also be applied to rotate the ellipse by a number of degrees.
msg.payload = { "name":"Bristol Channel", "lat":51.5, "lon":-2.9, "radius":[30000,70000], "tilt":45 };
You can add supplemental arc(s) to a marker by adding an arc property as below. Supplemental means that you can also specify a line using a bearing and length property.
msg.payload = { name:"Camera01", icon:"sensor", lat:51.05, lon:-1.35,
    bearing: 235,
    length: 2200,
    arc: {
        ranges: [500,1000,2000],
        pan: 228,
        fov: 40,
        color: '#aaaa00',
        weight: 1
    }
}
ranges can be a single number or an array of arc distances from the marker. The pan is the bearing of the centre of the arc, and the fov (Field of view) specifies the angle of the arc. Defaults are shown above.
There are several ways to send GeoJSON to the map.
-
If the msg.payload contains a geojson property, and no lat and lon, then rather than draw a point it will render the geojson.
msg.payload = { "name": "MyPolygon", "geojson": { "type": "Feature", "geometry": { "type": "Polygon", "coordinates": [[[-180,10],[20,90],[180,-5],[-30,-90]]] }, "style": { "stroke-width": "8", "stroke": "#ff00ff", "fill-color": "#808000", "fill-opacity": 0.2 } } }
Often geojson may not have a properties or style property in which case you can specify some global optional properties (see below) in order to set some defaults for the geojson object.
msg.payload = {
    "name": "Myline",
    "layer": "Lines",
    "color": "#0000ff",
    "weight": "6",
    "dashArray": "30 20",
    "geojson": {
        "type": "LineString",
        "coordinates": [[0,0],[0,90]]
    },
    clickable: true
}
-
You can just send a msg.payload containing the geojson itself - but obviously you then can't style it, set the name, layer, etc.
-
You can also add the geojson as a specific overlay, in which case you can also have more control of styles, and per feature customisations. See the section on overlays below. This is the most complex but also the most customisable.
Areas, Rectangles, Lines, Circles and Ellipses can also specify more optional properties:
- layer : declares which layer you put it on.
- color : can set the colour of the polygon or line.
- opacity : the opacity of the line or outline.
- fillColor : can set the fill colour of the polygon.
- fillOpacity : can set the opacity of the polygon fill colour.
- dashArray : optional dash array for polyline.
- clickable : boolean - set to true to allow click to show popup.
- popup : html string to display in popup (as well as name).
- editable : boolean - set to true to allow simple edit/delete right click contextmenu.
- tooltip : Text string to display on mouse hover over the shape.
- contextmenu : html string to display a more complex right click contextmenu.
- weight : the width of the line or outline.
Other properties can be found in the leaflet documentation.
Shapes can also have a popup property containing html, but you MUST also set a property clickable:true in order to allow it to be seen.
A single right click will allow you to add a point to the map - you must specify the name and optionally the icon and layer.
Right-clicking on an icon will allow you to delete it.
If you select the drawing layer you can also add and edit polylines, polygons, rectangles and circles. Once an item is drawn you can right click to edit or delete it.
Double click the object to exit edit mode.
The OSM Buildings layer is available in the layers menu. You can replace this with
buildings of your own by sending a msg.payload.command.map containing an overlay
and a geojson property. The geojson property should be a GeoJSON Feature Collection
as per the OSMBuildings spec. For example in a function node:
var geo = { "type": "FeatureCollection",
"features": [
  {
    "type": "Feature",
    "properties": {
      "color": "rgb(0,0,255)",
      "roofColor": "rgb(128,128,255)",
      "height": 20,
      "minHeight": 0
    },
    "geometry": {
      "type": "Polygon",
      "coordinates": [
        [
        [-1.356221,51.048611],
        [-1.356039,51.048672],
        [-1.355765,51.048311],
        [-1.355937,51.048237],
        [-1.356221,51.048611]
        ]
      ]
    }
  }
]
}
var m = {overlay:"Golf Clubhouse", geojson:geo, fit:true};
msg.payload = {command:{map:m, lat:51.0484, lon:-1.3558}};
return msg;
Note: the object you supply will replace the whole buildings layer. To delete the building send a msg with a name and the building property set to "" (blank string).
A 3D map view has now been added as worldmap/index3d.html using the mapbox api - the msg can support msg.command.pitch and msg.command.bearing to angle the view, for example:
msg.payload = { "command": { "zoom":18, "pitch":60, "bearing":80 } }
The icon can be specified as a person, block, bar, or "anything else" - they will render slightly differently - all units are approximate. They will be positioned at the lat, lon as normal but also at the msg.payload.height - where height is in meters above the surface of the map (which may or may not relate to altitude...)
msg.payload.icon can be
- person : 1m x 1m x 2m tall
- block : 5m x 5m x 5m cube
- bar : a bar from the surface up to the specified minHeight
- (else) : 1.5m x 1.5m x 1.5m cube
in addition existing male, female, fa-male and fa-female icons are all represented as the person shape.
msg.iconColor can be used to colour the icons.
NOTES
- There is currently no way to add labels, popups, or to make the icons clickable.
- The 3D only really works at zoomed in scales 16+ due to the small size of the icons. They are not scale independent like icons on the normal map.
- As this uses the mapbox api you may wish to edit the index3d.html code to include your api key to remove any usage restrictions.
- This view is a side project to the Node-RED Worldmap project so I'm happy to take PRs but it probably won't be actively developed.
You can also control the map via the node, by sending in a msg.payload containing a command object. Multiple parameters can be specified in one command.
Optional properties for msg.payload.command include
- lat - move map to specified latitude.
- lon - move map to specified longitude.
- zoom - move map to specified zoom level (1 - world, 13 to 20 max zoom depending on map).
-
bounds - if set to an array
[ [ lat(S), lon(W) ], [lat(N), lon(E)] ]- sets the overall map bounds. - rotation - rotate the base map to the specified compass angle.
-
layer - set map to specified base layer name -
{"command":{"layer":"Esri"}} -
search - search markers on map for name containing
string. If not found in existing markers, will then try geocoding looking using Nominatim. An empty string""clears the search results. -{"command":{"search":"Winchester"}} -
showlayer - show the named overlay(s) -
{"command":{"showlayer":"foo"}}or{"command":{"showlayer":["foo","bar"]}} -
hidelayer - hide the named overlay(s) -
{"command":{"hidelayer":"bar"}}or{"command":{"hidelayer":["bar","another"]}} -
side - add a second map alongside with slide between them. Use the name of a baselayer to add - or "none" to remove the control. -
{"command":{"side":"Esri Satellite"}} -
split - once you have split the screen with the side command - the split value is then the % across the screen of the split line. -
{"command":{"split":50}} -
map - Object containing details of a new map layer:
- name - name of the map base layer OR overlay - name of overlay layer
- url - url of the map layer
- opt - options object for the new layer
- wms - true/false/grey, specifies if the data is provided by a Web Map Service (if grey sets layer to greyscale)
- bounds - sets the bounds of an Overlay-Image. 2 Dimensional Array that defines the top-left and bottom-right Corners (lat/lon Points)
- delete - name or array of names of base layers and/or overlays to delete and remove from layer menu.
- heatmap - set heatmap latlngs array object see https://github.com/Leaflet/Leaflet.heat#reference
- options - if heatmap set, then use this to set heatmap options object see https://github.com/Leaflet/Leaflet.heat#reference
-
clear - layer name - to clear a complete layer and remove from layer menu -
{"command":{"clear":"myOldLayer"}} -
panlock - lock the map area to the current visible area. -
{"command":{"panlock":true}} -
panit - auto pan to the latest marker updated. -
{"command":{"panit":true}} -
zoomlock - locks the zoom control to the current value and removes zoom control -
{"command":{"zoomlock":true}} -
hiderightclick - disables the right click that allows adding or deleting points on the map -
{"command":{"hiderightclick":true}} -
coords - turns on and off a display of the current mouse co-ordinates. Values can be "deg", "dms", or "none" (default). -
{"command":{"coords":"deg"}} -
showruler - turns on and off a display of the ruler control. Values can be "true" or "false". -
{"command": {"ruler": {"showruler": true}}} -
button - if supplied with a
nameandiconproperty - adds a button to provide user input - sends a msg{"action":"button", "name":"the_button_name"}to the worldmap in node. If supplied with anameproperty only, it will remove the button. Optionalpositionproperty can be 'bottomright', 'bottomleft', 'topleft' or 'topright' (default). button can also be an array of button objects. -
contextmenu - html string to define the right click menu when not on a marker. Defaults to the simple add marker input. Empty string
""disables this right click. - toptitle - Words to replace title in title bar (if not in iframe)
- toplogo - URL to logo image for top title bar (if not in iframe) - ideally 60px by 24px.
-
trackme - Turns on/off the browser self locating. Boolean false = off, true = cyan circle showing accuracy error, or an object like
{"command":{"trackme":{"name":"Dave","icon":"car","iconColor":"blue","layer":"mytrack","accuracy":false}}}. Usual marker options can be applied. -
showmenu - Show or hide the display of the hamberger menu control in the top right . Values can be "show" or "hide". -
{"command":{"showmenu": "hide"}} -
showlayers - Show or hide the display of selectable layers. Does not control the display of an individual layer, rather a users ability to interact with them. Values can be "show" or "hide". -
{"command":{"showlayers": "hide"}}
msg.payload = { "command": { "layer":"Esri Satellite", "lat":51, "lon":3, "zoom":10 }};
You can also use the name "none" to completely remove the base layer,
msg.payload = { "command": { "layer":"none" }};
msg.payload = { "command": { "clear: "name of the layer/overlay you wish to clear" }};
Feeding this into the tracks node will also remove the tracks stored for that layer.
The layer will be called name. By default it expects a leaflet Tilelayer style url. You can also use a WMS
style server by adding a property wms: true. You can also set wms: "grey" to set the layer to greyscale which
may let your markers be more visible. (see overlay example below).
Also useful is the Leaflet option maxNativeZoom which can allow scaling of maps beyond their natural maximum zoom level.
msg.payload.command.map = {
    "name":"OSMhot",  // use "overlay":"MyOverlayName" for an overlay rather than a base layer.
    "url":"https://{s}.tile.openstreetmap.fr/hot/{z}/{x}/{y}.png",
    "opt":{ "maxZoom":19, "attribution":"© OpenStreetMap" }
};
To remove several layers, either base layers or overlays, you can pass an array of names as follows. This can be used to tidy up the initial selections available to the user layer menu.
msg.payload.command.map = {
    "delete":["Watercolor","ship nav","heatmap","Terrain","UK OS 1900","UK OS 1919-47"]
};
Note: layer names are case sensitive.
To add an overlay instead of a base layer - specify the overlay property instead of the name.
msg.payload.command.map = {
    "overlay": "NowCoast",
    "url": "https://nowcoast.noaa.gov/arcgis/services/nowcoast/radar_meteo_imagery_nexrad_time/MapServer/WmsServer?",
    "opt":  {
        "layers": "1",
        "format": "image/png",
        "transparent": true,
        "attribution": "NOAA/NWS"
    },
    "wms": true
}
By default the overlay will be instantly visible. To load it hidden add a property to the command.map - visible:false
msg.payload.command.map = {
    "overlay": "myGeoJSON",
    "geojson": { your geojson feature as an object },
    "opt": { optional geojson options, style, etc },
    "fit": true,
    "clickable": false
};
The geojson features may contain a properties property. That may also include a style with properties - stroke, stroke-width, stroke-opacity, fill, fill-opacity. Any other properties will be listed in the popup.
The opt property is optional. See the Leaflet geojson docs for more info on possible options.
NOTE: In order to pass over style, pointToLayer, onEachFeature, or filter functions they need to be serialised as follows... for example
const style = function () {
    return { color: "#910000", weight: 2 };
};
msg.payload.command.map.opt.style = style.toString();
This may cause the function node setting them to be in error, for example if it references L (the leaflet map), which is unknown on the server side. The flow should still deploy and run ok.
The fit property is optional, and you can also use fly if you wish. If boolean true the map will automatically zoom to fit the area relevant to the geojson, or use 'fly' to set the animated style. You can also set clickable true to return the properties of the clicked feature to the worldmap-in node.
As with the geojson overlay, you can also inject a KML layer, GPX layer or TOPOJSON layer. The syntax is the same but with either a kml property containing the KML string - a gpx property containing a GPX string - or a topojson property containing the topojson.
msg.payload.command.map = {
    "overlay": "myKML",
    "kml": "<kml>...your kml placemarks...</kml>"
};
For GPX and KML layers, it is possible to define which icon to use for point markers by adding the
following properties to msg.payload.command.map:
- icon : font awesome icon name.
- iconColor : Standard CSS colour name or #rrggbb hex value.
Again the boolean fit or fly properties can be added to make the map zoom to the relevant area, and the visible property can be set false to not immediately show the layer.
As per the geojson overlay you can also inject an ESRI ArcGIS FeatureLayer layer. The syntax is the same but with an esri property containing the url of the desired feature layer.
msg.payload.command.map = {
    "overlay": "myFeatureLayer",
    "esri": "https://services3.arcgis.com/...../0",
    "opt": { object of options }
};
NOTE: you can set various options as specified here.
In order to pass over style, pointToLayer, or onEachFeature functions they need to be serialised as follows. For example
const style = function () {
    return { color: "#910000", weight: 2 };
};
msg.payload.command.map.opt.style = style.toString();
This may cause the function node setting them to be in error, for example if it references L.marker, which is unknown on the server side. The flow should still deploy and run ok.
You can overlay an image as long as you can specify the lower-left and upper-right corners. For example in a function node:
var imageBounds = [[40.712216, -74.22655], [40.773941, -74.12544]];
msg.payload = { command : { lat:40.74, lon:-74.175, zoom:13 } };
msg.payload.command.map = {
    overlay: "New York Historical",
    url: 'https://www.lib.utexas.edu/maps/historical/newark_nj_1922.jpg',
    bounds: imageBounds,
    opt: { opacity:0.8, attribution:"© University of Texas" }
};
msg.payload.command.map = {
    "overlay": "myWind",
    "velocity": {
        "displayValues": true,
        "displayOptions": {
            "velocityType": "Global Wind",
            "displayPosition": "bottomleft",
            "emptyString": "No wind data",
            "showCardinal": true,
            "speedUnit": "k/h",
            "angleConvention": "meteoCCW"
        },
        "maxVelocity": 15,
        "data": [Array of data as per format referenced below]
    }
};
see https://github.com/danwild/leaflet-velocity for more details about options and data examples.
Note: If you use his wind-js-server you need to patch it as per issue 9. Or you can use try this docker image which uses the Canadian Meterological Service model instead.
docker run -d -p 7000:7000 --name windserver theceejay/windserver:latest
A graticule can be enabled via the node configuration, and can also be set dynamically, for example in a function node:
msg.payload = { command : { grid : {
    showgrid: true,
    opt: { showLabel:true, dashArray:[5, 5], fontColor:"#900" }
};
see https://github.com/cloudybay/leaflet.latlng-graticule for more details about options and demo.
to add a button bottom right
msg.payload.command = { "button": { "name":"My Fancy Button", "icon": "fa-star", "position":"bottomright" } };
When clicked the button will send an event to the worldmap in node containing {"action":"button", "name","My Fancy Button"} - this can then be used to trigger other map commands or flows.
to remove
msg.payload.command = { "button": { "name":"My Fancy Button" } };
Multiple buttons can declared by using an array of button objects.
You can customise a marker's popup, or context menu (right click), by setting the appropriate property to an html string. Often you will need some embedded javascript in order to make it do something when you click a button for example. You need to be careful escaping quotes, and that they remain matched.
For example a marker popup with a slider (note the \ escaping the internal ' )
popup: '<input name="slide1" type="range" min="1" max="100" value="50" onchange=\'feedback(${name},this.value,this.name)\' style="width:250px;">'
Or a marker contextmenu with an input box
contextmenu: '<input name="channel" type="text" value="5" onchange=\'feedback(${name},{"name":this.name,"value":this.value},"myFeedback")\' />'
Or you can add a contextmenu to the map. Simple contextmenu with a button
msg.payload.command = {
    contextmenu: '<button name="Clicker" onclick=\'feedback(this.name,"ping!",null,true)\'>Click me</button>'
}
Or with an input box
msg.payload.command : {
    contextmenu: '<input name="slide1" type="range" min="1" max="100" value="50" onchange=\'feedback(this.name,this.value,"myEventName")\' >'
}
Example simple form
[{"id":"7351100bacb1f5fe","type":"function","z":"4aa2ed2fd1b11362","name":"","func":"msg.payload = { command: {\ncontextmenu: String.raw`\nText <input type=\"text\" id=\"sometext\" value=\"hello\"><br/>\nNumber <input type=\"number\" id=\"somenum\" value=\"5\"><br/>\n<input type=\"button\" value=\"Send\" onclick=\n'feedback(\"myform\",{\n \"st\":document.getElementById(\"sometext\").value,\n \"sn\":document.getElementById(\"somenum\").value,\n})'\n>\n`\n}}\nreturn msg;","outputs":1,"noerr":0,"initialize":"","finalize":"","libs":[],"x":350,"y":360,"wires":[["a6a82f2e8efc44fc"]]},{"id":"7b595f0c8f6ac710","type":"worldmap in","z":"4aa2ed2fd1b11362","name":"","path":"/worldmap","events":"connect","x":195,"y":360,"wires":[["7351100bacb1f5fe"]]}]
See the section on Utility Functions for details of the feedback function.
If you want to add a small legend overlay
msg.payload.command = { "legend": "<b>Title</b></br><i style=\"background: #477AC2\"></i> Water<br><i style=\"background: #448D40\"></i> Forest<br>" };
To remove set the legend to an empty string "".
A minimap overview can be added by sending a suitable command. The "minimap" property must specify the name of an existing base layer to use. The "opt" property can contain valid options from the minimap library options.
msg.payload.command.map = {
        minimap: "OSM",
        opt: {
            centerFixed: [51.05, -1.35],
            toggleDisplay: true
        }
    }
};
Set msg.payload.command.map.minimap = false; to remove the minimap.
The worldmap in node can be used to receive various events from the map. Examples of messages coming FROM the map include:
{ "action": "connected" }  // useful to trigger delivery or redraw of points
{ "action": "disconnect", "clients": 1 }  // when a client disconnects - reports number remaining
{"action":"bounds", "south":50.55, "west":-1.48, "north":50.72, "east":-0.98}  // reports the outer bounds of the hmap area when zoomed or moved

{ "action": "click", "name":"Jason", "layer":"gps", "icon":"male", "iconColor":"blue", "lat":51.024985, "lon":-1.39698 }   // when a marker is clicked
{ "action": "move", "name":"Jason", "layer":"gps", "icon":"male", "iconColor":"blue", "lat":51.044632, "lon":-1.359901 }    // when a marker is moved
{ "action": "delete", "name": "Jason" }  // when a point or shape is deleted

{ "action": "point", "lat": "50.60634", "lon": "-1.66580", "point": "Jason,male,gps" }
{ "action": "draw", "type": "rectangle", "points": [ { "lat": 50.61243889044519, "lng": -1.5913009643554688 }, { "lat": 50.66665471366635, "lng": -1.5913009643554688 }, { "lat": 50.66665471366635, "lng": -1.4742279052734375 }, { "lat": 50.61243889044519, "lng": -1.4742279052734375 } ] }

{ "action": "layer", "name": "myLayer" }      // when a map layer is changed
{ "action": "addlayer", "name": "myLayer" }   // when a new map layer is added
{ "action": "dellayer", "name": "myLayer" }   // when a new map layer is deleted

{ "action": "file", "name": "myfilename", "type":"image/jpeg", "lat":51, "lon":-1, "content":"....."}   // when a file is dropped on the map - see below.

{ "action": "button", "name": "My Fancy Button" } // when a user defined button is clicked

{ "action": "feedback", "name": "some name", "value": "some value", "lat":51, "lon":0, "layer":"unknown" } // when a user calls the feedback function - see below
If File Drop is enabled - then the map can accept files of type gpx, kml, nvg, jpeg, png and geojson. The file content property will always be a binary buffer. The lat, lon of the cursor drop point will be included. Tracks will be locally rendered on the map. The node-red-node-exif node can be used to extract location information from a jpeg image and then geolocate it back on the map. Png images will be located where they are dropped but can then be dragged if required.
All actions also include a:
msg._sessionid property that indicates which client session they came from. Any msg sent out that includes this property will ONLY be sent to that session - so you can target map updates to specific sessions if required.
msg._sessionip property that shows the ip of the client that is connected to the session.
The "connected" action additionally includes a:
msg.payload.parameters property object that lists the parameters sent in the url.
msg.payload.clientTimezone property string showing the clients local Timezone. Returns bool of false if unable to retrive clients local Timezone.
msg._clientheaders property that shows the headers sent by the client to make a connection to the session.
There are some internal functions available to make interacting with Node-RED easier (e.g. from inside a user defined popup., these include:
-
feedback() : it takes 2, 3, or 4 parameters, name, value, and optionally an action name (defaults to "feedback"), and optional boolean to close the popup on calling this function, and can be used inside something like an input tag -
onchange='feedback(this.name,this.value,null,true)'. Value can be a more complex object if required as long as it is serialisable. If used with a marker the name should be that of the marker - you can use${name}to let it be substituted automatically. -
addToForm() : takes a property name value pair to add to a variable called
form. When used with contextmenu feedback (above) you can set the feedback value to"_form"to substitute this accumulated value. This allows you to do things likeonBlur='addToForm(this.name,this.value)'over several different fields in the menu and then usefeedback(this.name,"_form")to submit them all at once. For example a simple multiple line form could be as per the example below:
Also if you wish to retain the values between separate openings of this form you can assign property names to the value field in the form value="${foo}, etc. These will then appear as part of an value property on the worldmap-in node message.
var menu = 'Add some data <input name="foo" value="${foo}" onchange=\'addToForm(this.name,this.value)\'></input><br/>'
menu += 'Add more data <input name="bar" value="${bar}" onchange=\'addToForm(this.name,this.value)\'></input><br/>'
menu += '<button name="my_form" onclick=\'feedback(this.name,"_form",null,true)\'>Submit</button>'
msg.payload = { command: { "contextmenu":menu } }
-
delMarker() : takes the name of the marker as a parameter. In a popup this can be specified as
${name}for dynamic substitution. -
editPoly() : takes the name of the shape or line as a parameter. In a popup this can be specified as
${name}for dynamic substitution.
By default this node expects users to have access to the internet in order to access the map servers that provide all the built in mapping. As per above you are able to add your own sources of mapping and sometimes this includes the requirement for offline access, in which case maps must be served up locally. There are several ways to do this outlined below. My personal favourite is the Tileserver-gl docker option, but of course this does require Docker.
You can use a PMtiles format map archive file from Protomaps as a base layer map.
Note: the whole planet file is over 100GB so be warned both for local storage and your download speed. You can download or extract just a portion of it if you use the pmtiles command line with the extract option. Use pmtiles extract --help to see the options.
Copy your .pmtiles file(s) into your ~/.node-red user directory. On re-starting Node-RED the node will detect the file(s) and add them to the base map layer menu, using the file name as the layer name.
You can set some default options for the pmtiles by creating a file called pmtiles.opts in your user directory. For example to create a nightvision style
{
    "attribution": "Protomaps and OSM",
    "maxDataZoom": 15,
    "maxZoom": 20,
    "shade": "red",
    "dark": true
}
The maxDataZoom should match the maximum zoom level in you pmtiles file(s) - whereas the maxZoom is the leaflet maximum zoom level you want to support. shade can be any valid html colour or #rrggbb string, and dark is a boolean (default false).
You can also load them dynamically with a command like
msg.payload = {"command":{"map":{"name":"MyMap", "pmtiles":"/path/to/mymap.pmtiles", "opt":myOptionsObject}}}
Where opt can be as per the options file mentioned above - or omitted completely.
I have found the easiest to use mapserver for a decent generic map to be Tileserver-gl. It uses mbtiles format maps - for example from MapTiler Data. You can download your mbtiles file into a directory and then from that directory run
docker run --name maptiler -d -v $(pwd):/data -p 1884:8080 maptiler/tileserver-gl -p 8080 --mbtiles yourMapFile.mbtiles
and use a url like "url": "http://localhost:1884/styles/basic-preview/{z}/{x}/{y}.png"
Other more traditional map servers include containers like https://hub.docker.com/r/camptocamp/mapserver, then assuming you have the mapfile 'my-app.map' in the current working directory, you could mount it as:
docker run -d --name camptocamp -v $(pwd):/etc/mapserver/:ro -p 1881:80 camptocamp/mapserver
then the url should be of the form "url": "http://localhost:1881/?map=/etc/mapserver/my-app.map" where my-app.map is the name of your map file. A quick test of the server would be to browse to http://localhost:1881/?map=/etc/mapserver/my-app.map&mode=map
Or you can use a docker container like https://hub.docker.com/r/geodata/mapserver/ then assuming you have the mapfile 'my-app.map' in the current working directory, you could mount it as:
docker run -d --name mapserver -v $(pwd):/maps:ro -p 1882:80 geodata/mapserver
and use a url like "url": "http://localhost:1882/?map=/maps/my-app.map",
Other useful map servers include Geoserver, a somewhat larger image but fully featured.
docker run --name geoserver -d -v ${PWD}:/var/local/geoserver -p 1885:8080 oscarfonts/geoserver
IMHO the easiest WMS map server to make work is the mapserver package in Ubuntu / Debian. Usually you will start with
sudo apt-get install mapserver-bin cgi-mapserver gdal-bin
Configuring that, setting up your tiles, and creating a .map file is way beyond the scope of this README so I will leave that as an exercise for the reader. Once set up you should have a cgi process you can run called mapserv, and a .map file that describes the layers available from the server.
Create and edit these into an executeable file called mapserv, located in this node's directory, typically
~/.node-red/node_modules/node-red-contrib-web-worldmap/mapserv, for example:
#! /bin/sh
# set this to the path of your WMS map file (which in turn points to your tiles)
MS_MAPFILE=/home/pi/maps/gb.map
export MS_MAPFILE
# and set this to the path of your cgi-mapserv executable
/usr/bin/mapserv
You can then add a new WMS Base layer by injecting a message like
msg.payload = { command : { map : {
    "name": "Local WMS",
    "url": "/cgi-bin/mapserv",   // we will serve the tiles from this node locally.
    "opt": {
        "layers": "gb",          // specifies a layer in your map file
        "format": "image/png",
        "transparent": true,
        "attribution": "© Ordnance Survey, UK"
    },
    "wms": true                  // set to true for WMS type mapserver
}}}
There are several examples included when you install the node. Navigate to the menu - Import - Examples - node-red-contrib-web-worldmap
The following example gets recent earthquakes from USGS, parses the result, formats up the msg as per above and sends to the node to plot on the map. It also shows how to zoom and move the map or add a new layer.
[{"id":"86457344.50e6b","type":"inject","z":"cb7b09e3354afd4c","name":"","repeat":"","crontab":"","once":false,"topic":"","payload":"","payloadType":"none","x":170,"y":500,"wires":[["9a142026.fa47f"]]},{"id":"9a142026.fa47f","type":"function","z":"cb7b09e3354afd4c","name":"add new layer","func":"msg.payload = {};\nmsg.payload.command = {};\n\nvar u = 'http://{s}.tile.openstreetmap.fr/hot/{z}/{x}/{y}.png';\nvar o = { maxZoom: 19, attribution: '© OpenStreetMap'};\n\nmsg.payload.command.map = {name:\"OSMhot\", url:u, opt:o};\nmsg.payload.command.layer = \"OSMhot\";\n\nreturn msg;","outputs":1,"timeout":"","noerr":0,"initialize":"","finalize":"","libs":[],"x":400,"y":500,"wires":[["c643e022.1816c"]]},{"id":"c643e022.1816c","type":"worldmap","z":"cb7b09e3354afd4c","name":"","lat":"30","lon":"0","zoom":"3","layer":"OSMG","cluster":"","maxage":"","usermenu":"show","layers":"show","panit":"false","panlock":"false","zoomlock":"false","hiderightclick":"false","coords":"deg","showgrid":"false","showruler":"false","allowFileDrop":"false","path":"worldmap","overlist":"CO,RA,DN","maplist":"OSMG,OSMH,EsriS","mapname":"","mapurl":"","mapopt":"","mapwms":false,"x":640,"y":540,"wires":[]},{"id":"2998e233.4ba64e","type":"function","z":"cb7b09e3354afd4c","name":"USGS Quake monitor csv re-parse","func":"msg.payload.lat = msg.payload.latitude;\nmsg.payload.lon = msg.payload.longitude;\nmsg.payload.layer = \"earthquake\";\nmsg.payload.name = msg.payload.id;\nmsg.payload.icon = \"globe\";\nmsg.payload.iconColor = \"orange\";\n\ndelete msg.payload.latitude;\ndelete msg.payload.longitude;\t\nreturn msg;","outputs":1,"timeout":"","noerr":0,"initialize":"","finalize":"","libs":[],"x":520,"y":640,"wires":[["c643e022.1816c"]]},{"id":"e72c5732.9fa198","type":"function","z":"cb7b09e3354afd4c","name":"move and zoom","func":"msg.payload = { command:{layer:\"Esri Terrain\",lat:0,lon:-90,zoom:2} };\nreturn msg;","outputs":1,"timeout":"","noerr":0,"initialize":"","finalize":"","libs":[],"x":400,"y":540,"wires":[["c643e022.1816c"]]},{"id":"12317723.589249","type":"csv","z":"cb7b09e3354afd4c","name":"","sep":",","hdrin":true,"hdrout":"","multi":"one","ret":"\\n","temp":"","x":370,"y":580,"wires":[["2998e233.4ba64e"]]},{"id":"10e5e5f0.8daeaa","type":"inject","z":"cb7b09e3354afd4c","name":"","repeat":"","crontab":"","once":false,"topic":"","payload":"","payloadType":"none","x":170,"y":540,"wires":[["e72c5732.9fa198"]]},{"id":"b6917d83.d1bac","type":"http request","z":"cb7b09e3354afd4c","name":"","method":"GET","url":"http://earthquake.usgs.gov/earthquakes/feed/v1.0/summary/2.5_day.csv","x":250,"y":640,"wires":[["12317723.589249"]]},{"id":"3842171.4d487e8","type":"inject","z":"cb7b09e3354afd4c","name":"Quakes","repeat":"900","crontab":"","once":false,"topic":"","payload":"","payloadType":"none","x":180,"y":580,"wires":[["b6917d83.d1bac"]]}]
Car, Bus and Helicopter icons originally made by Freepik from www.flaticon.com are licensed by CC 3.0 BY.