model.js

A functional reactive model library - Model.js manages the execution flow of the data flow graphs you define. Kind of like Backbone and React, but simpler and designed specifically for making D3 easier to use. Also check out Chiasm, a visualization runtime engine built on Model.js.
- Annotated Source
- Unit Tests
- Examples:


Installable via Bower: bower install model.
Installable via JSPM: jspm install model=github:curran/model.
Usable as:
- an AMD (RequireJS) module
define(["model"], function(Model){ ... }); - a CommonJS (Node) module
var Model = require("model"); - a browser global
<script src="model.js"></script>
Also, check out this redesign of this library - reactive-model.
Public API
var model = Model([defaults]);
- The model constructor function.
- Using "new" is optional.
- The optional
defaultsconstructor argument is an object with default property values. - The returned
modelobject can be treated as a plain JavaScript Object for setting and getting property values, e.g.model.x = 5;console.log(model.x);
var listener = model.when(properties, callback [, thisArg]);
- Listens for changes to the given dependency properties.
propertiesEither an array of strings or a string. Specifies the dependency properties.callbackA callback function that is called:- with dependency property values as arguments,
- only if all dependency properties have values,
- once for initialization,
- whenever one or more dependency properties change,
- on the next tick of the JavaScript event loop after dependency properties change,
- only once as a result of one or more changes to dependency properties.
thisArgAn optional argument bound tothisin the callback.- Returns a
listenerobject that can be used to remove the callback.
model.cancel(listener)
- Removes the listener returned by
when. This means the callback will no longer be called when properties change.
model.on(property, callback(newValue, oldValue)[, thisArg])
- Adds a change listener for the given property.
- Kind of like on in Backbone
model.off(property, callback)
- Removes a change listener for the given property.
- Kind of like off in Backbone
model.set(values)
- A convenience function for setting many model properties at once.
- Assigns each property from the given
valuesobject to the model. - This function can be used to deserialize models, e.g.:
var json = JSON.stringify(model);- ... later on ..
model.set(JSON.parse(json));
Data Dependency Graphs
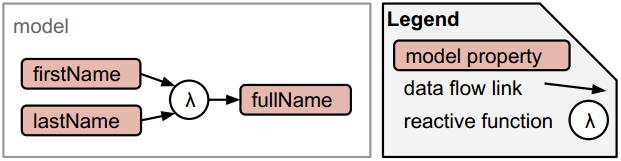
Setting model properties in when callbacks enables creating reactive data dependency graphs. . As a simple example, consider a fullName property that is computed from firstName and lastName.
model;
Here's a full working example that computes fullName and uses HTML forms.
The following example demonstrates construction of a data dependency graph in which the flow propagates two hops from x to y to z.
model;model;
This pattern can be used to build up reactive data dependency graphs of arbitrary complexity.
Reactive Visualizations
As an example of how data dependency graphs can be used for creating visualizations, consider this bar chart.
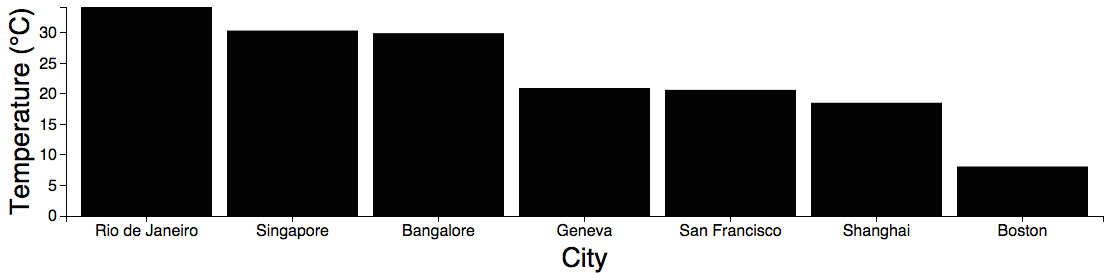
This is the reactive data flow graph of the bar chart.

The diagram was constructed using the reactive flow diagram renderer. Lambdas represent reactive functions, and labeled nodes represent model properties.
Though the entire reactive flow may seem complex, programming it is simple, because each reactive function is defined independently, only knowing about its direct dependencies and the properties that it changes. This is why functional reactive programming is so great.
Multiple reactive visualizations can be combined together to form visualization dashboards with multiple linked views. For example, take a look at the linked views example, which looks like this:
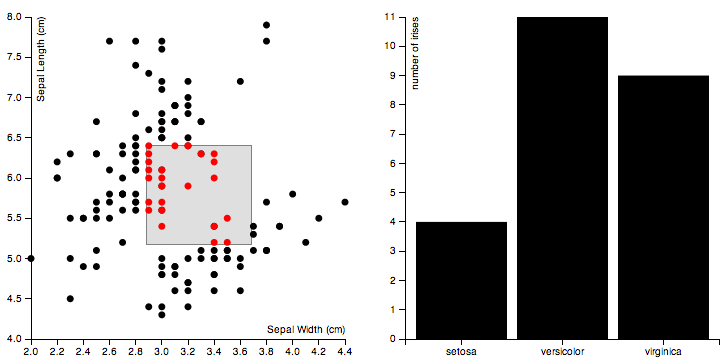 Brushing in the scatter plot causes the selected data to be aggregated and plotted in the bar chart ([run it!](http://curran.github.io/model/examples/d3LinkedViews/)).
See Also
- Talk on YouTube This talk presents Model.js and how it can be used to construct reactive data visualizations with D3. Presented in California at the Bay Area D3 Meetup, July 2014.
- Presentation on GitHub, Incremental Bar Chart Example Code (use left/right arrows)
- Examples
Motivation
This library was created in order to cleanly define reactive model-driven data visualizations. When using Backbone and Underscore to define model-driven visualizations, there is a pattern that appears again and again for executing code that depends on multiple model properties. For example, consider a Backbone model that has a size property that contains the width and height of the visualization, and a data property that contains the array of data to be visualized. This is the code you want to write:
model;However, with the above code, if only one or two of the properties are set, the function will be invoked before all properties are defined. Therefore a null check must be added for all properties as follows:
model;The above code now does not break, but has another issue. When width and height are both updated, the function is invoked twice. Ideally, when width and height are updated in sequence (e.g. model.set('width', 50); model.set('height', 100);), the function should only be invoked once with the new values for both width and height. Also, multiple sequential updates to width or height (e.g. model.set('width', 0); model.set('width', 50);) should only result in a single recomputation of the visualization, using the last value (in this case 50). One way to accomplish this is to debounce the function as follows:
model;The above code behaves as desired - the visualization is only built when all properties are present, and only once when multiple properties change together. As this pattern is so common in developing model driven data visualizations, it would be useful to abstract it away into a reusable function. The model.when function does exactly that. Using model.when, the above code becomes:
model;As this was the only usage pattern I encountered with models when using Backbone for developing visualizations, I decided to introduce a new library that only contains the essential features needed from Backbone Models (in order to remove the Backbone dependency), and the when function, which appears in the world of Functional Reactive Programming and makes working with models for visualizations much nicer. This is why model.js was created.
Related Work
Inspired by
- Models in Backbone.js
- The
whenoperator in Functional Reactive Programming - Computed properties in Ember.js
- Dependency injection in Angular.js
- Dependency declaration syntax in Require.js
See also:
- Towards Reusable Charts A pattern for creating reusable charts (model.js presents an alternative to this)
- GitHub: vogievetsky/DVL A functional reactive library for use with D3.js.
- Stackoverflow: how to implement observer pattern in javascript? - Contains bare minimum model implementation that was the seed of this project.
- Backbone.js mailing list: Improving the Backbone Model API with wire() First pass at functional reactive models, built on Backbone models.
- wire.js The original implementation of the idea for this library, as an extension to Backbone Models.
- Backbone Pull Request
- Model.js featured in Dashing D3.js
- Computed properties in Ember.js A similar system.
- Video Demo of Linked Choropleth from D3 Bay Area Meetup
Contributing
Pull requests welcome! Potential contributions include:
- Add a DOM-based example
- Add more generalized D3 examples! For example:
- Add a D3 example with UI elements such as a drop down menu for selecting fields to use in the visualization.
By Curran Kelleher May 2015