Navigation: Docs/Reference | Demo Playground | Github Source

![]()
![]()
Math-Script
A math library for JS with an emphasis on matrix operations, non linear solvers, visualizations, and overload support!.
var M = ; M;Core features:
- Matrix operations operator support in execute environment
*, +, **, - - Feature rich [M,N] matrix operation support, see reference
- SVD support / Nonlinear solvers
Install
NPM Installation:
npm install math-script
Browser minimal:
See dist folder for files
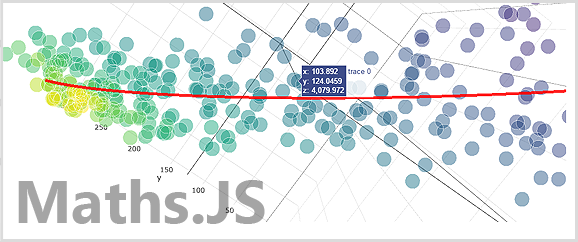
Math-Script with Plotting
Library Application Sample
Linear Regression Example:
This example uses linear least squares to identify a best fitting polynomial to arbitrary data. This example demonstrates the matrix and plotting functionality of libary.
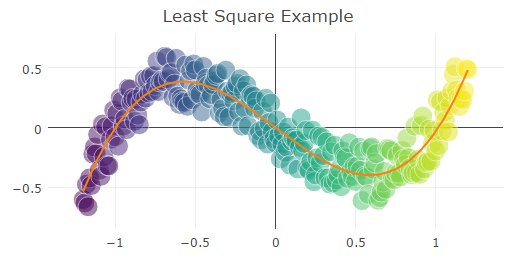
var X = Matrixs; // Creates a matrixs with a range of values var Y = X; // Y = X^3 - X + noise // Create a column matrix for a least square solution [x^3,x^2,x,1] var A = X; var x = A; // Least squares solution var yFit = A; // Ax = Y plotyLayoutshowlegend= false;plotyLayouttitle= 'Least Square Example'; Plots; Plots;Basic Matrix Examples
Maths.js supports numerous matrixs opperations. Below is small sampling and see here for the matrixs reference.
Matrix Creation:
var A = Matrixs; //creates a 3x3 matrix A; //prints matrix //Results //1.000 2.000 3.000//4.000 5.000 6.000//7.000 8.000 5.000Matrix Opperations (Addition, Multiplicaiton ...ect): One can add or perform any basic matrix opperation with scalars or other matricies. These commands can be sequentially chained.
var A = Matrixs; //creates a 3x3 matrix A; // adds scalar of 1 to matrix, then adds a 3x3 matrix, then prints result.//Results//3.000 5.000 7.000//5.000 6.000 7.000//8.000 9.000 6.000Matrix Inversion: Maths.js can invert arbitrary sized(e.g. 100x100) singular and non singular(with SVD) matricies.
var A = 123456789; //creates a 3x3 matrixA; //Prints after inverison. Print is set to 3 decimals //Results: //-0.639 -0.167 0.306//-0.056 0.000 0.056//0.528 0.167 -0.194Basic Plot Example
Simple Line and Scatter Plot :
Maths.js can easily create plots for visualization. Please see here for the plot reference. . The backbone of this library is plotly whos backbone is D3 meaning the plots are SVG based.
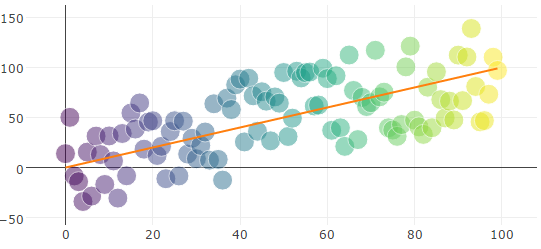
var X = Matrixs; // Creates a 0-99 value arrayvar Y = X; // Adds 90% relative noise Plots; //Creates scatter plot Plots; // Adds orange best fit line