
leaft-lonlat-gridlines
基于leaflet封装的带经纬度数值标注的经纬度(瓦片)网格线绘制插件,可自定义线和标注的颜色及显示方位!
阿里镜像手动更新:https://npmmirror.com/sync/leaflet-lonlat-gridlines
1 用法
1.1 安装
安装此插件前请先确保应用中已经安装了leaflet依赖,支持的lf版本需 >= 1.0.1(1.0.0及以下版本不支持,高版本是向下兼容的放心安装);一般旧应用leaflet版本定在^1.5.1即可(1.5.0版本有问题),新一点的可能是^1.7.0,截止推包npm仓库中最新的leaflet版本是1.9.2(2022-10-04号左右发布的)。
npm install leaflet@^1.5.1 or yarn add leaflet@^1.5.1
安装此插件,建议安装最新版本,低版本作为最初调试用的可能存在一些问题。
npm install leaflet-lonlat-gridlines or yarn add leaflet-lonlat-gridlines
基于上述,应用中的leaflet和leaflet-lonlat-gridlines的依赖最终显示如下:
 "dependencies": {
    "leaflet": "1.5.1",
    "leaflet-lonlat-gridlines": "1.x.x"
  },
1.2 引入
引入很简单,直接在相应的页面/组件中import即可,如下:
import {LeafletDrawLonlatLine} from "leaflet-lonlat-gridlines";1.3 使用
具体应用案例可参考我的Gitee代码仓库:https://gitee.com/appleyk/leaflet-lonlat-gridlines-test
1.3.1 默认配置
import React, { Component } from "react";
import L from "leaflet";
import {LeafletDrawLonlatLine} from "leaflet-lonlat-gridlines";
export default class MapView extends Component {
constructor(props) {
super(props);
}
componentDidMount() {
this.initMap();
}
componentWillUnmount() {
/**释放资源,移除经纬线相关图层和地图事件*/
this.lonLatGridLines && this.lonLatGridLines.removeDrawEvent();
}
initMap() {
console.log(L);
let option = {
/** 使用官方自带的默认的zoom组件*/
zoomControl: true,
/** 是否将 attribution 版权控件添加到地图中,这里设置false*/
attributionControl: false,
/** 将地图视图限制在给定的范围内 */
maxBounds: L.latLngBounds(L.latLng(-85.06, -180), L.latLng(85.06, 180)),
/** 最大缩放层级 */
maxZoom: 18,
/** 最小缩放层级(一般3级就行了,再多显示效果就不好了!) */
minZoom: 3,
};
let map = L.map("map", option);
map.setView([[33, 112], 12);
let arcgis ="https://server.arcgisonline.com/arcgis/rest/services/World_Imagery/MapServer/tile/{z}/{y}/{x}";
L.tileLayer(arcgis, { maxZoom: 18 }).addTo(map);
/** 创建经纬线网格绘制对象*/
this.lonLatGridLines = new LeafletDrawLonlatLine(map);
/** 初始化话的时候,触发一次绘制*/
this.lonLatGridLines.drawLonlatTileGrid();
/** 添加绘制地图事件(即拖动地图时,清除上一次的图层的同时绘制新的图层)*/
this.lonLatGridLines.addDrawEvent();
}
render() {
return <div id="map" className="container"></div>;
}
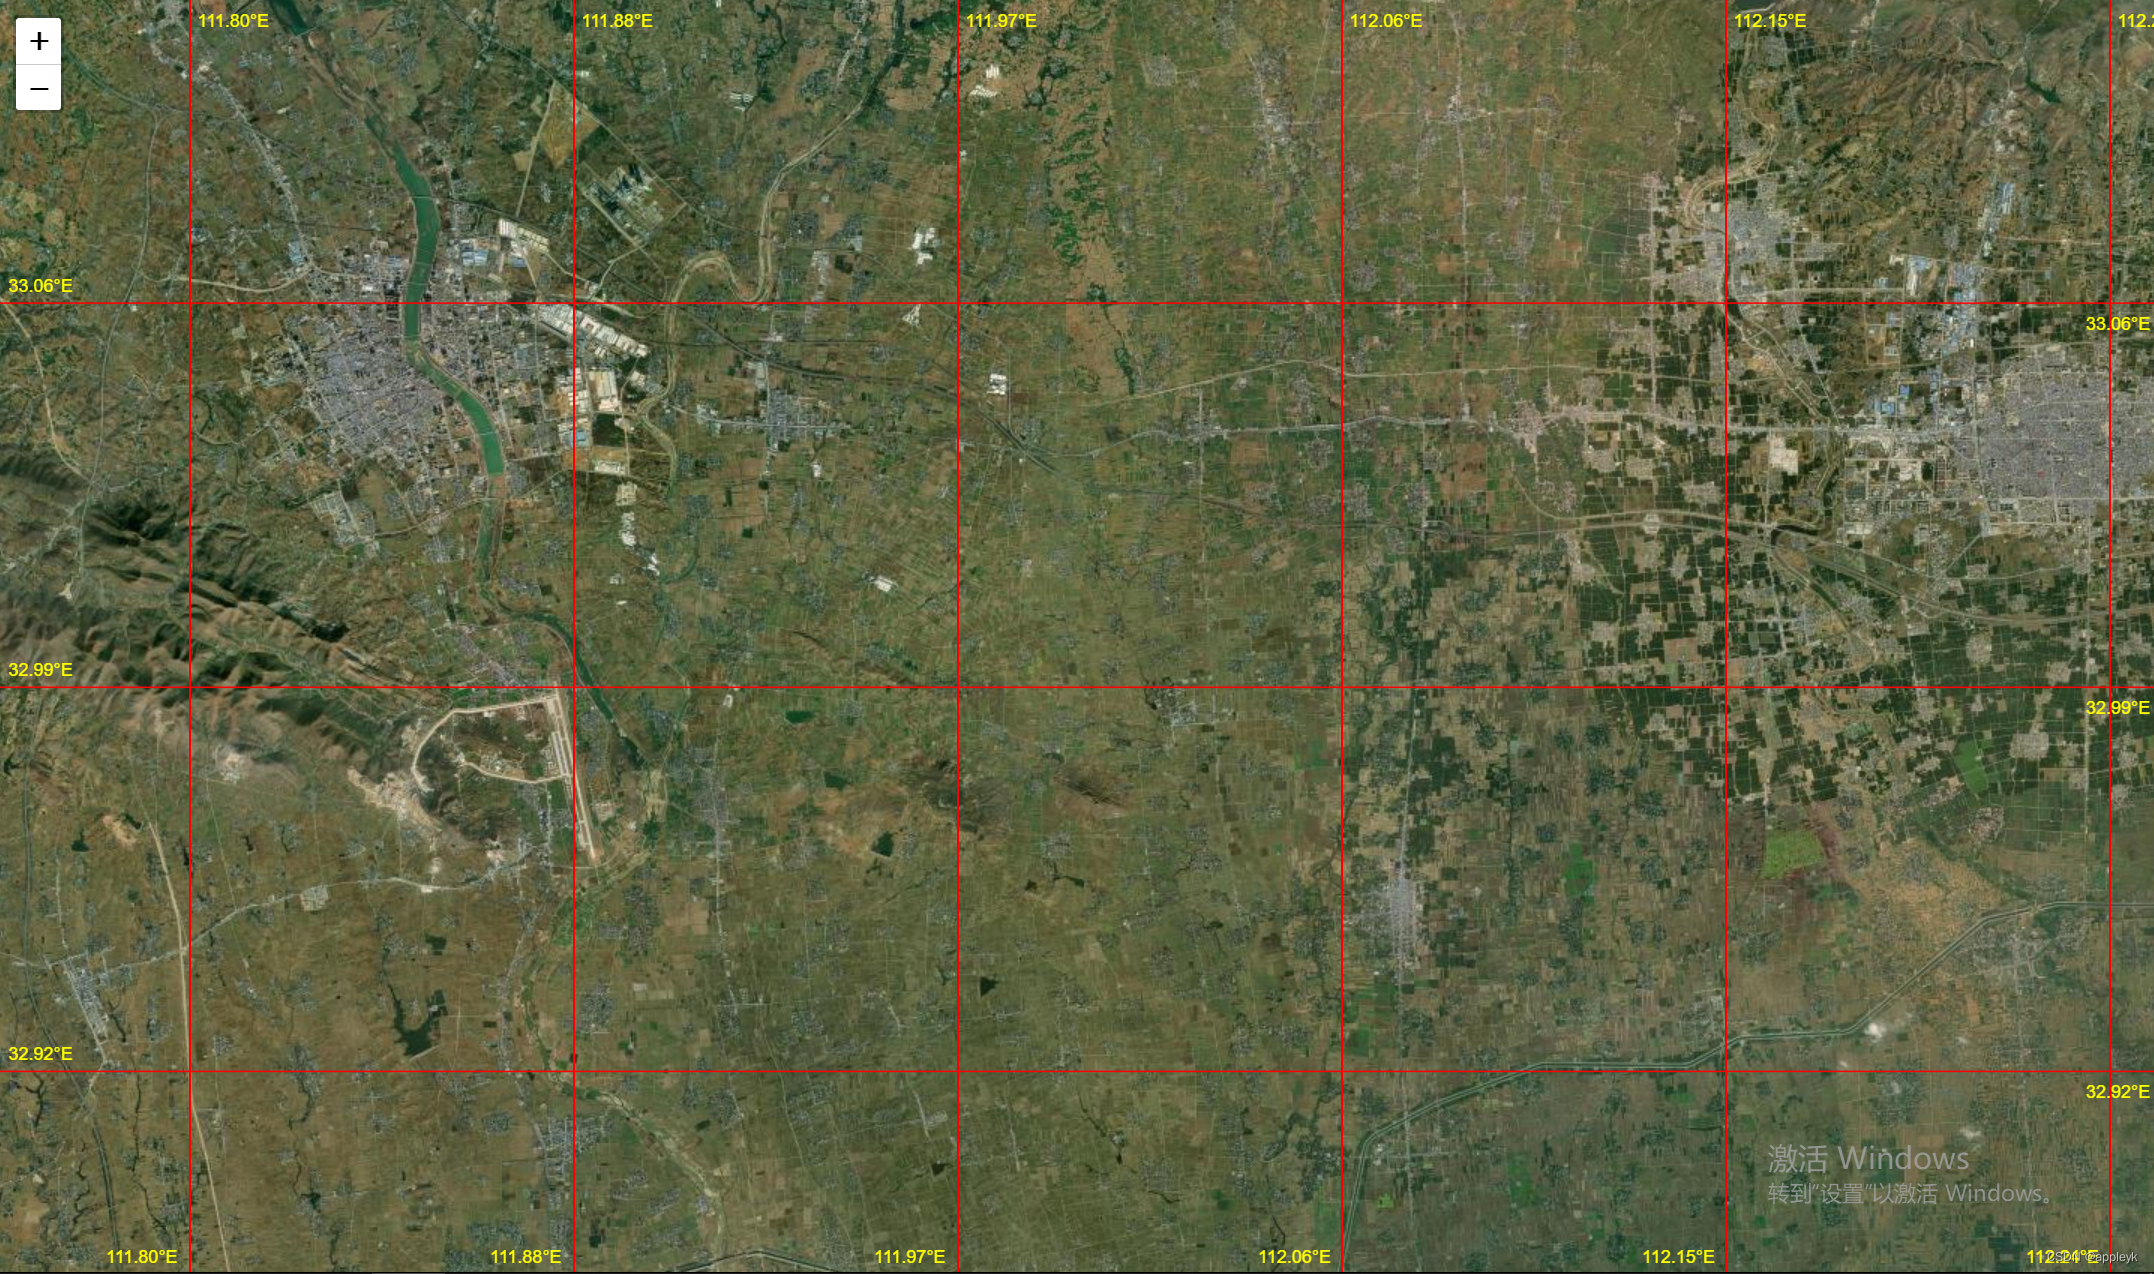
}效果图:
1.3.2 插件参数
插件工具类LeafletDrawLonlatLine的属性如下
| 参数 | 说明 | 类型 | 默认值 |
|---|---|---|---|
| map | leaflet地图对象,需要外部传进来 | L.map() | 无 |
| lonLatGridLineLayers | 经纬线网格要素图层组 | L.featureGroup() | 初始化时构建 |
| lineColor | 经纬线的颜色值,可通过setLineColor("xxx")设置新值 | String | red |
| textColor | 经纬度文本标注的颜色,可通过setTextColor("xxx")设置新值 | String | yellow |
| textPosition | 经纬度文本标注的显示方位,all表示南北东西方向均显示,left表示只显示西边和南边方向,right表示只显示北边和东边方向。可通过setTextPosition("xxx")设置新值 | String | all |
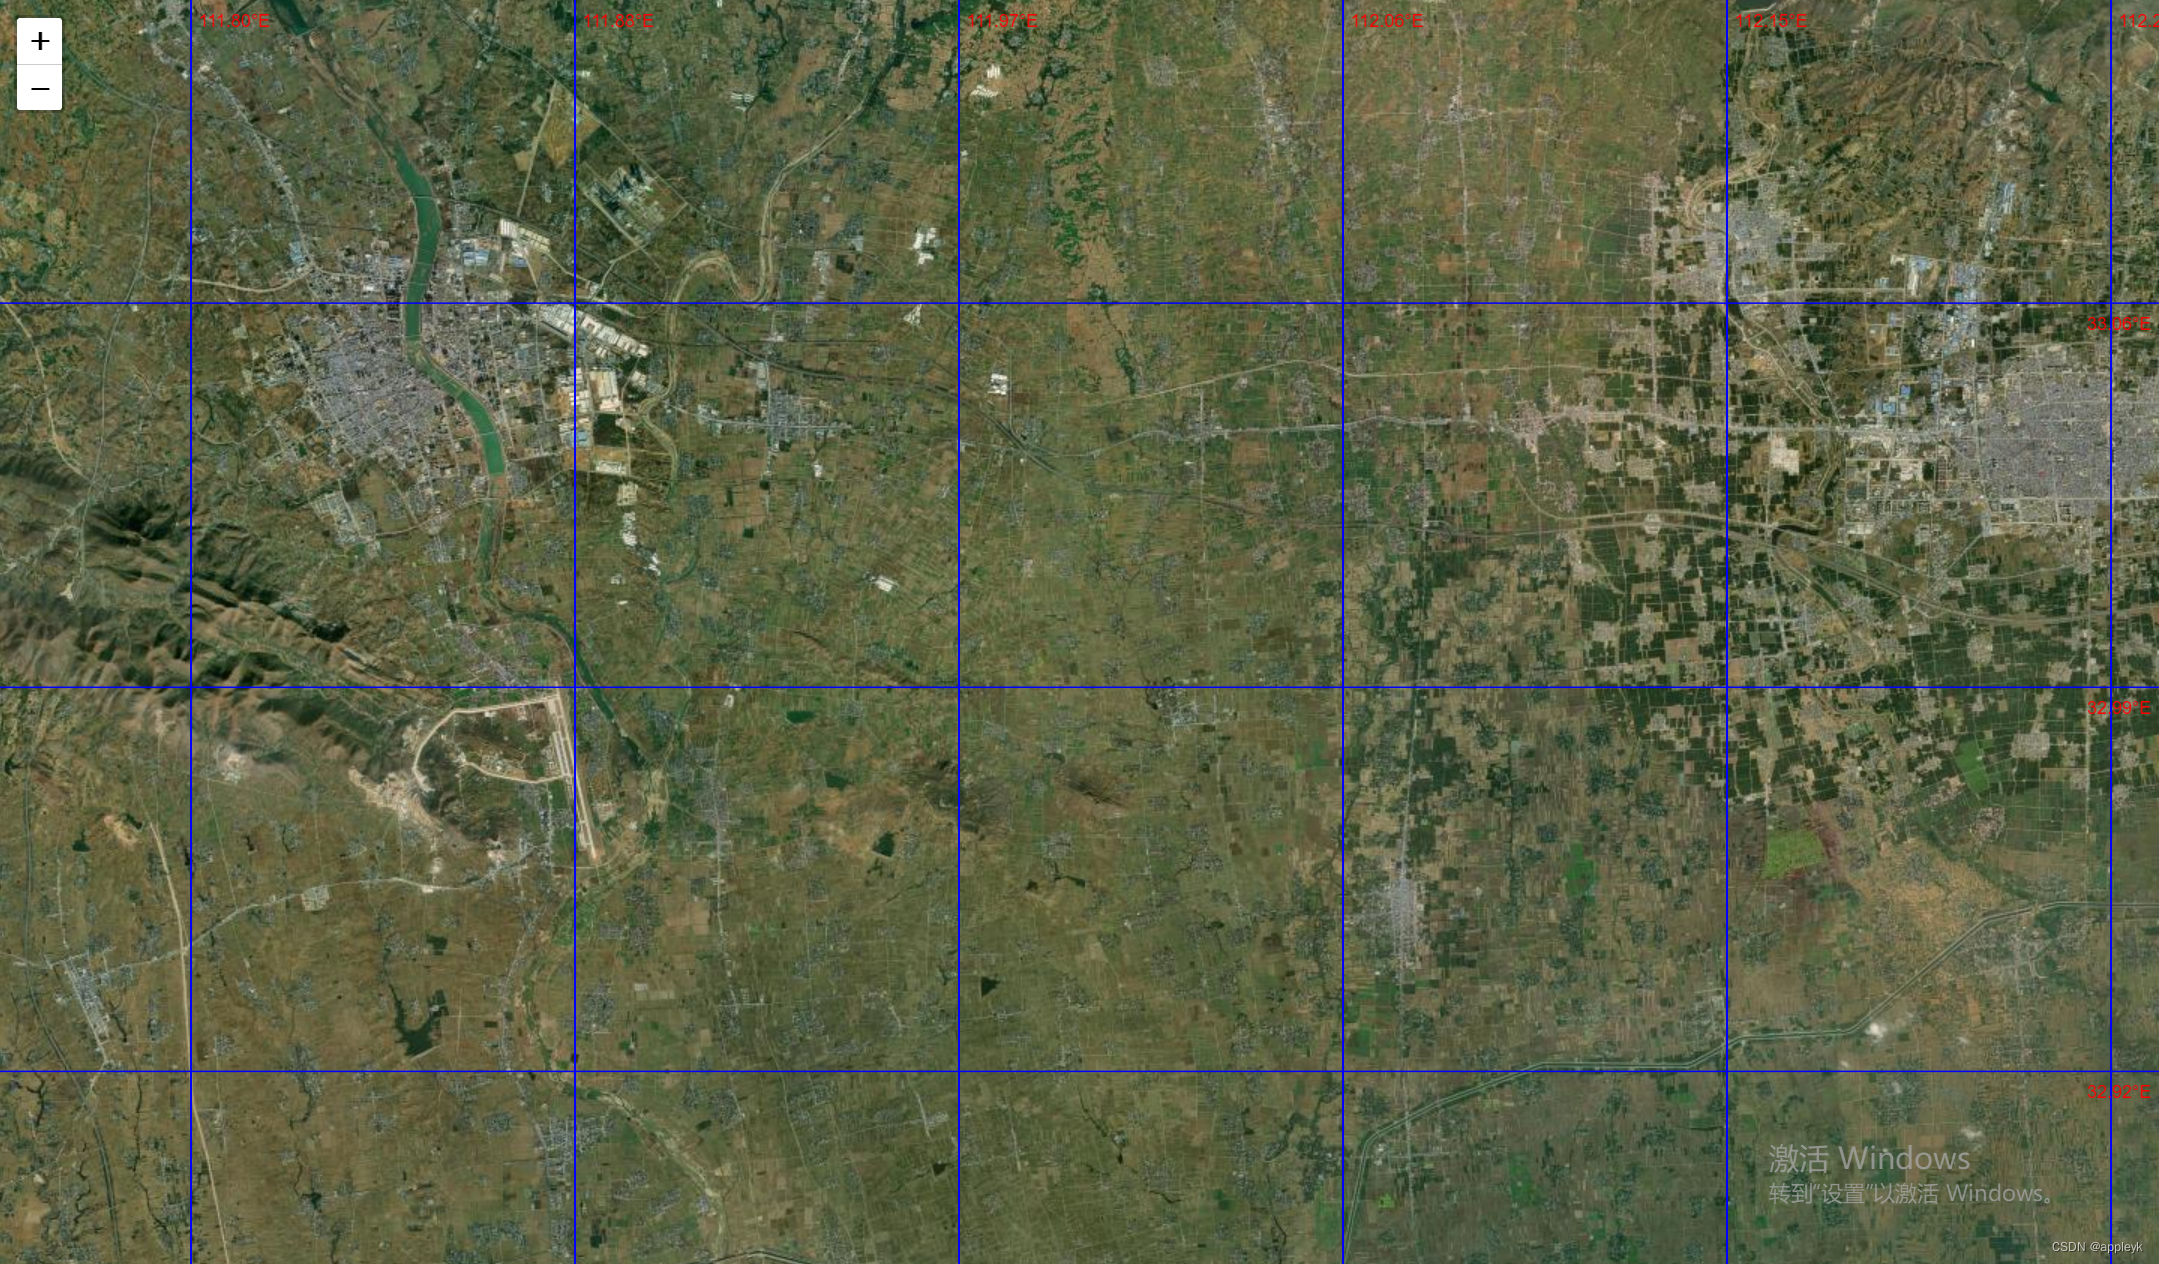
1.3.3 自定义配置
   this.lonLatGridLines = new LeafletDrawLonlatLine(map);
   /**经纬线设置为蓝色*/
   this.lonLatGridLines.setLineColor("blue");
   /**经纬线度数文本颜色调整为红色*/
   this.lonLatGridLines.setTextColor("red");
   /**经纬线度数文本只显示北边(经度值)和东边(纬度值)*/
   this.lonLatGridLines.setTextPosition("right");
   /** 初始化话的时候,触发一次绘制*/
   this.lonLatGridLines.drawLonlatTileGrid();
   /** 添加绘制地图事件(即拖动地图时,清除上一次的图层的同时绘制新的图层)*/
   this.lonLatGridLines.addDrawEvent();
效果图:
2 关于我
不定期会更新技术博客:https://blog.csdn.net/Appleyk
不定期会更新代码仓库:https://github.com/kobeyk
本插件博客地址:https://blog.csdn.net/Appleyk/article/details/127468947