Charkit
NOTE: This is a tempory fork. Will do PR and delete this
Chartkit provides deep integration between the Angular framework and the wonderful Highcharts library.
The Problem
When building a serious data visualization app, you often end up with a Highcharts configuration object that runs several hundred or perhaps thousands lines long. Since this is a single object, it is not particularly modular. Similarly, Angular uses directives for its view layer, which are also configuration objects. Hence you end up with a long object in a link function in another long object.
In Chartkit, charts are their own DI object. So instead of writing something like this:
angular;You can simplify to this:
angular;Which will achieve the same result.
Native HTML rendering
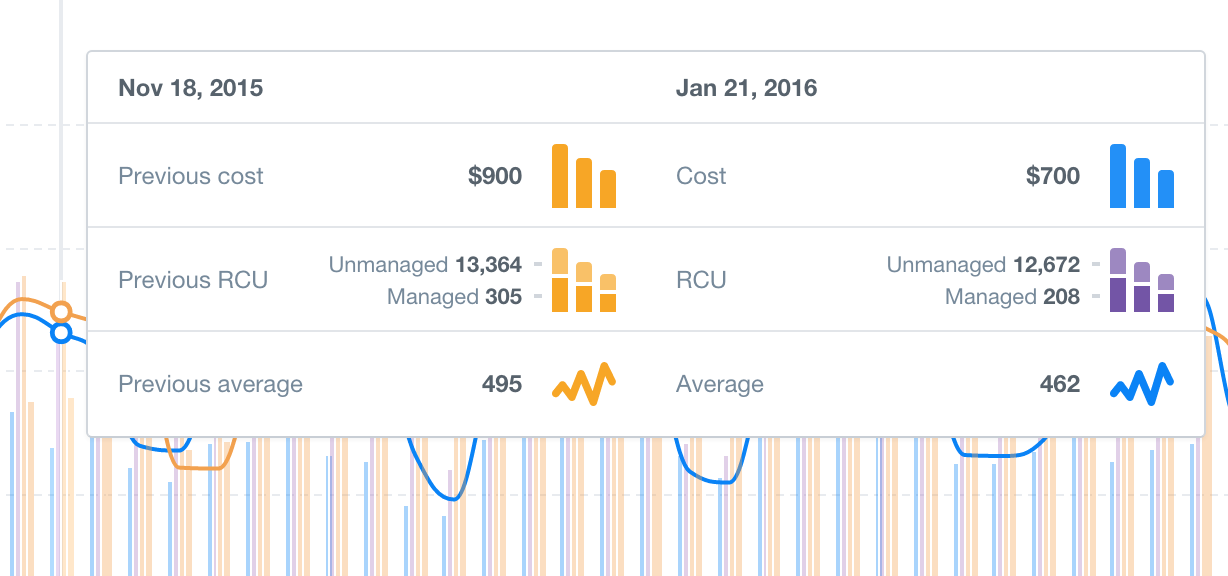
Highcharts support HTML in tooltips and a bunch of other places. However, the templating system seems designed for very simple HTML formatting. Building real world data visualization software, you find yourself building tooltips like this:
For this rendering tooltips via string concatenation becomes quickly annoying. Finally it
usually involves slightly different templating language then you use in the rest of the
app (we used Lo-dash's _.template function before Charkit). This becomes quickly annoying.
Chartkit solves this problem by allowing you to pass an object anywhere where Highcharts
supports a formatter function (i.e. tooltips, dataLabels, axis labels). This object
can have either a template or templateUrl key, which is the Angular templating
system. It runs natively (i.e. doesn't try to extract HTML strings and parse them
again) and supports the whole Angular system, including directives, controllers, etc.
So instead of doing something like:
tooltip: useHTML: true { return _this; } You can now do:
tooltip: useHTML: true formatter: templateUrl: 'views/overview/chart_tooltip.html' {{point.series.name}} {{ point.y}} Which is much nicer. This allows you to also abstract complex logic into its own directive.
Note: Currently this requires you to set the useHTML option to true. Chartkit will
throw if this is not the case. We may support SVG rendering in the future, but currently
you will still need to use the Highcharts native API for that.
Directive API
The chart method accepts an injectable factory function, that should return a
chart definition object (this is exactly like directives). The chart definition
object is passed to the Highcharts constructor (this means you should still be able
to copy & paste snippets of Highcharts config into your chart factories). However,
the chart definition object accepts some extra keys. We've mentioned the special
treatment of formatter keys. In addition the object can contain the keys: require,
link and scope, which are the same as the Angular directive API.
The scope defaults to {data: '='} and serves as a standard way for charts to
receive data from controllers.
The link function will be called with the regular parameters. The final controllers
parameter will contain a reference to the Highcharts object containing your chart,
which will have been already initialized by the time the link function runs. This
will allow you to do any custom rendering.
transform
If you have data as a scope variable (i.e. you either keep the defaults or add it
yourself), you can also pass a transform key in the chart definition object. This
is a convenience high-level API, since often chart directive need to wait for API requests to
complete before they render their data. The transform function will be called with
the contents of the data scope variable whenever that changes and is considered
non-empty. The transform(data, chart, scope) function is called and should return
an array of series objects, which should contain an id property and some data.
These series objects are watched and the chart is automatically updated as appropriate (i.e. missing series will be deleted, new ones added, and changed ones will be updated).
If you have a loading key in
your config, Chartkit will also automatically call
Chart.showLoading and
Chart.hideLoading for
you.
User Input
In Angular user input is handled by directives and scope binding. Highcharts on the
other hand use events objects. We wrap the events objects for you passing an additional
parameter at the end which is the scope object. We will also handle triggering a
digest for you.
events: { scopeselected = eventpointcategory; } Set globals
Often you have a shared style. With Chartkit you can do something like this:
angular;Maintainers
Maintained by Jakub Hampl (@gampleman) - http://gampleman.eu
License
(c) RightScale, inc. 2016
MIT License
Permission is hereby granted, free of charge, to any person obtaining a copy of this software and associated documentation files (the "Software"), to deal in the Software without restriction, including without limitation the rights to use, copy, modify, merge, publish, distribute, sublicense, and/or sell copies of the Software, and to permit persons to whom the Software is furnished to do so, subject to the following conditions:
The above copyright notice and this permission notice shall be included in all copies or substantial portions of the Software.
THE SOFTWARE IS PROVIDED "AS IS", WITHOUT WARRANTY OF ANY KIND, EXPRESS OR IMPLIED, INCLUDING BUT NOT LIMITED TO THE WARRANTIES OF MERCHANTABILITY, FITNESS FOR A PARTICULAR PURPOSE AND NONINFRINGEMENT. IN NO EVENT SHALL THE AUTHORS OR COPYRIGHT HOLDERS BE LIABLE FOR ANY CLAIM, DAMAGES OR OTHER LIABILITY, WHETHER IN AN ACTION OF CONTRACT, TORT OR OTHERWISE, ARISING FROM, OUT OF OR IN CONNECTION WITH THE SOFTWARE OR THE USE OR OTHER DEALINGS IN THE SOFTWARE.