
Gauss-Jordan + Regression JavaScript library


Installation
npm i gordan --save
Usage
; // for ES6const Gordan = ; // for NodeMain API
Gordan.solveByGaussJordan(matrix)
-
matrix: the augmented matrix, a bidimensional array -
Returns: the identity matrix with the solution coefficients
Gordan.getLinearRegressionRect(points)
- Returns: a list of points for the regression rect
Gordan.getQuadraticRegressionCurve(points)
- Returns: a list of points for the regression curve (from cuadratic equation)
Gordan.getRegressionPath(points, N)
-
Returns: a list of points for an Nth grade equation (
ax^N + bx^(N - 1) + cx^(N - 2) + ...) -
points: for all cases, a list ofx, ypoints. The following formats are supported:
Secondary API
Gordan.addRows(row1, row2, [invert1[, invert2]])
-
row1: first row to add, a number array -
row2: second row to add, a number array -
invert1: boolean, if present, values inrow1are multiplied by-1 -
invert2: boolean, if present, values inrow2are multiplied by-1 -
Returns: the addition of the 2 rows (
number[])
Gordan.multiplyRow(row, value)
-
row: the row to multiply, a number array -
value: each number inrowis multiplied by this number -
Returns: a new row with the multipled values (
number[])
Gordan.divideRow(row, value)
-
row: the row to divide, a number array -
value: each number inrowis divided by this number -
Returns: a new row with the divided values (
number[])
Gordan.getSymbolValues(matrix)
-
matrix: the augmented matrix, a bidimensional array -
Returns: the last column of the resulting identity matrix (
number[])
Gordan.normalizePoints(points)
-
points: an array of[x, y]or{x, y}points -
Returns: an array of points with
{x, y}format
Gordan.getRegressionMatrixFromPoints(points, degreeOfEquation)```
-
points: an array of[x, y]or{x, y}points -
degreeOfEquation: a number greater than zero -
Returns: the regression augmented matrix
Gordan.getRange(points, axis)
-
points: an array of[x, y]or{x, y}points -
axis: a string'x'or'y' -
Returns:
'x'/'y'limits on the plane for the given points
Gauss-Jordan example
let gaussJordanMatrix = 1 -2 2 -3 15 3 4 -1 1 -6 2 -3 2 -1 17 1 1 -3 -2 -7 ; let solvedMatrix = Gordan;Results in:
1, 	0, 	0, 	0, 	2

0, 	1, 	0, 	0, 	-2

0, 	0, 	1, 	0, 	3

0, 	0, 	0, 	1, 	-1
Regression example
let points = 1 2 15 4 2 24 3 5 4 3 55 93 5 6 6 10 65 85 65 13 7 125; let rect = Gordan;let curve = Gordan;let gradeSixCurve = Gordan;Results in:
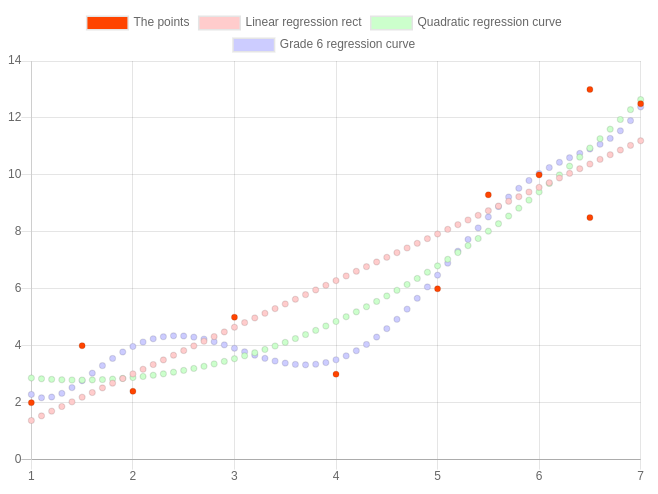
Here's the Chart.js code needed for that:
let chart = document type: 'scatter' data: datasets: label: 'The points' data: Gordan backgroundColor: '#f40' label: 'Linear regression rect' data: rect backgroundColor: '#fcc' label: 'Quadratic regression curve' data: curve backgroundColor: '#cfc' label: 'Grade 6 regression curve' data: gradeSixCurve backgroundColor: '#ccf' options: responsive: true ;