gl-plot3d
This is the core module for 3D plotting in gl-vis. It is compatible with the following modules:
- gl-scatter3d: 3D scatter plots
- gl-line3d: 3D line plots
- gl-surface3d: 3D surface plots
- gl-mesh3d: General mesh drawing
This module (and this whole subecosystem) skew more towards the easy-side of the simple vs. easy tradeoff spectrum. It has lots of options, but has opinionated and reasonable defaults which should make it suitable for small projects like mesh viewers or knocking out one-off data visualizations. If you want more precise, low level control, check out stack.gl.
Examples
Scatter plot
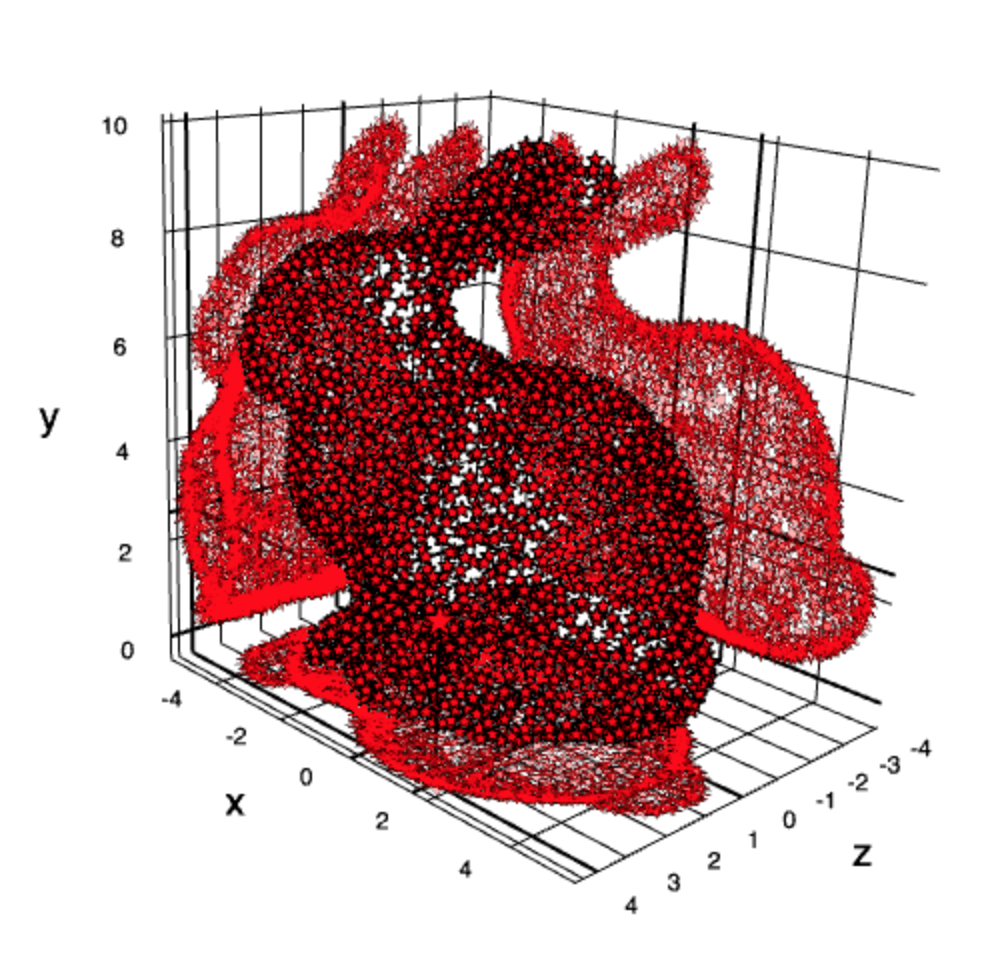
![]()
var createScene = createScenevar createCamera = createCameravar createScatter = var bunny = var scene = var scatter = sceneLine plot
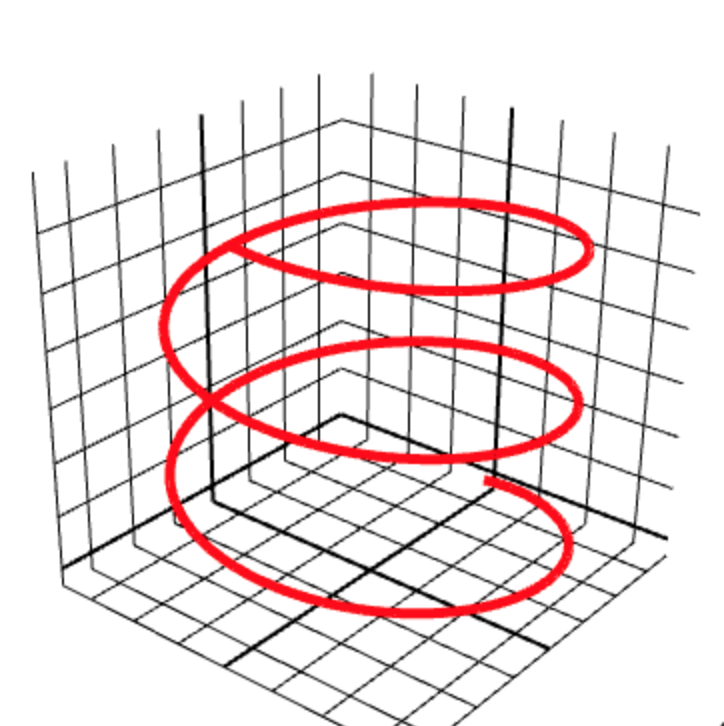
![]()
var createScene = createScenevar createLine = var scene = var points = forvar t = 0; t< 1000; ++t var theta = MathPI * t / 2000 points var linePlot = sceneSurfaces
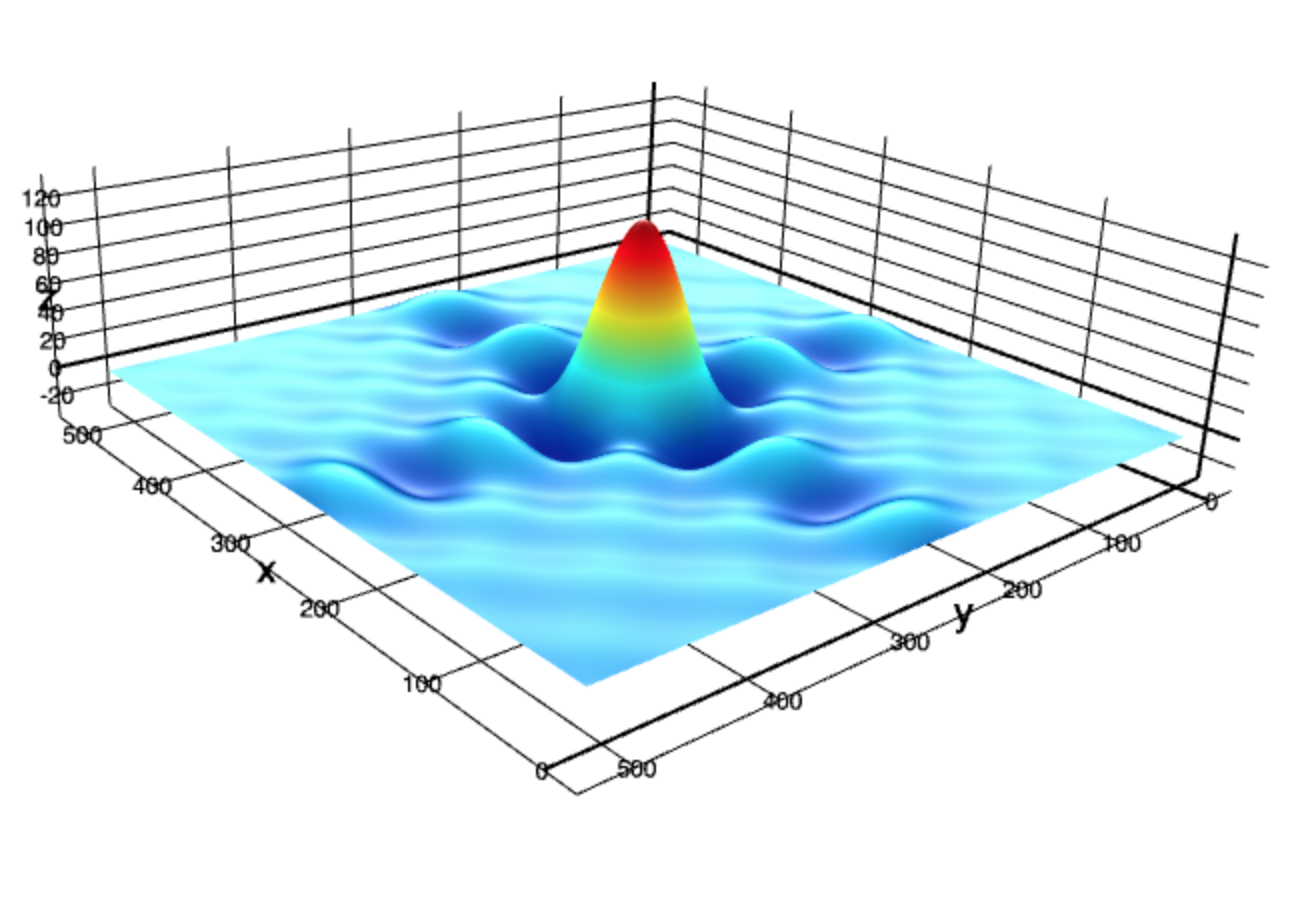
![]()
var createScene = createScenevar createSurfacePlot = var ndarray = var fill = var diric = var scene = var field = var surface = sceneParametric surfaces
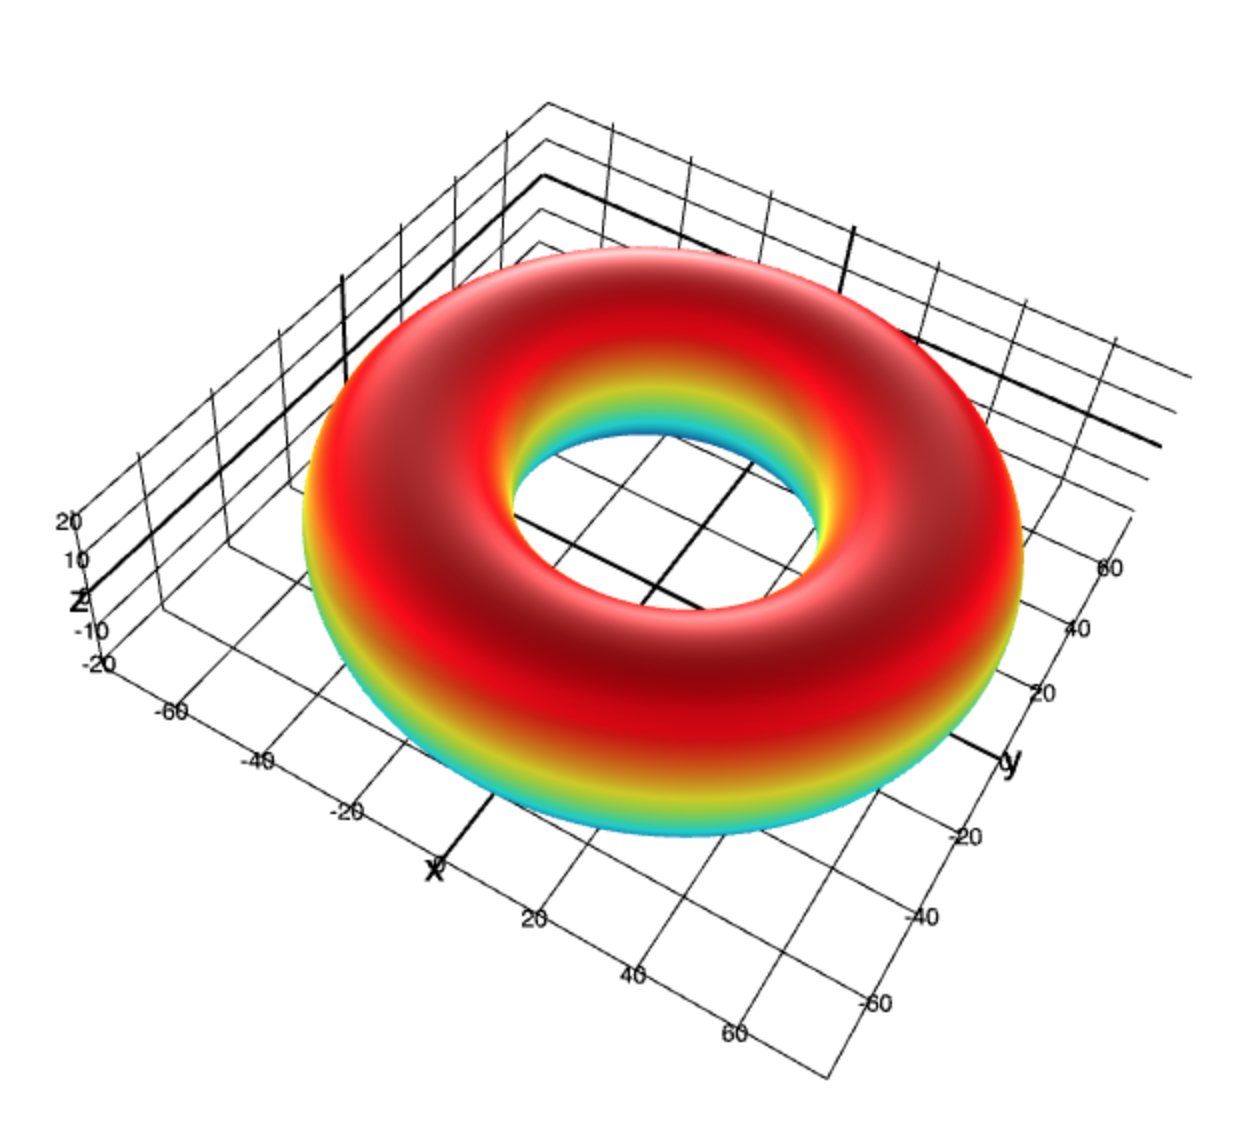
![]()
var createScene = createScenevar createSurface = var ndarray = var scene = var size = 64var coords = forvar i=0; i<=2*size; ++i var theta = MathPI * i - size / size forvar j=0; j<=2*size; ++j var phi = MathPI * j - size / size coords0 coords1 coords2 var surface = sceneMeshes
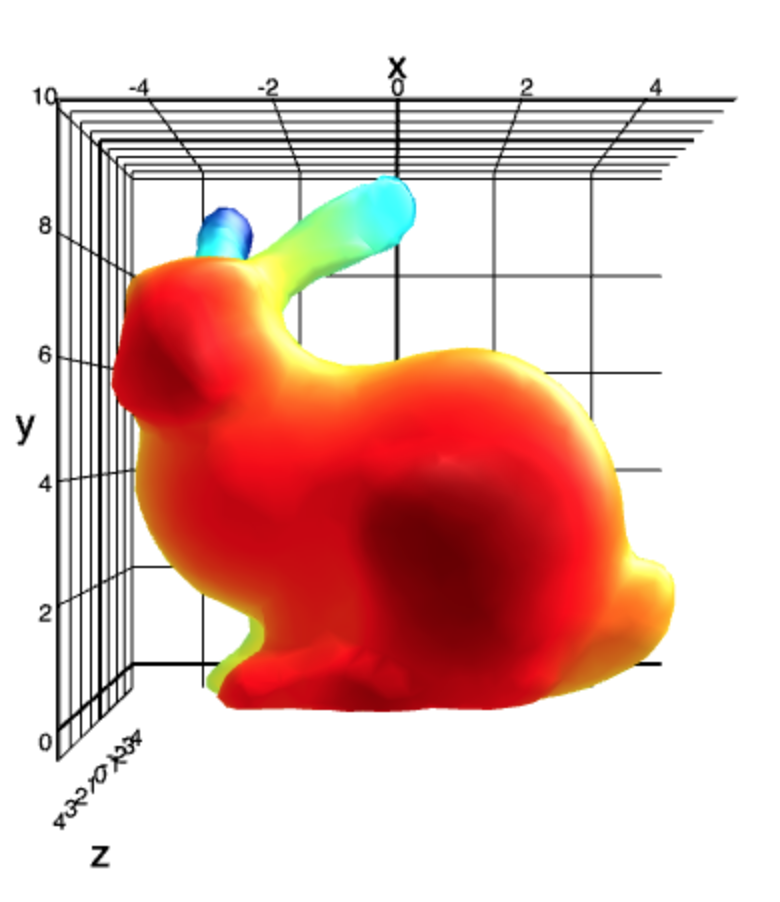
![]()
var createScene = createScenevar createMesh = var bunny = var scene = var mesh = sceneWireframe meshes
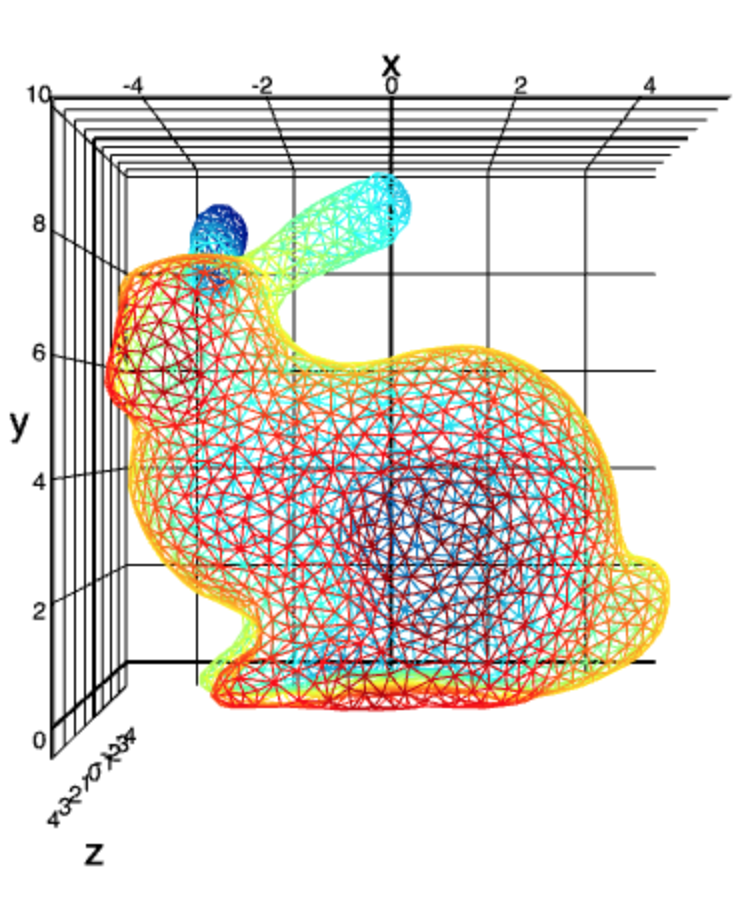
![]()
var createScene = createScenevar createMesh = var bunny = var sc = var scene = var mesh = sceneInstall
npm i gl-plot3d
API
Scene Constructor
var scene = require('gl-plot3d').createScene(canvas[, options])
Creates a new scene object.
canvasis an HTML canvas element into which the scene is inserted. (If not specified, a new fullscreen canvas is created and appended to the document)glis a WebGL context (If not specified, a new context is created)glOptionsis a set of options passed to the new WebGL context,glis not specifiedcameraan object storing camera options. See orbiter for more detailsaxesoptions passed to the axes object. See gl-axes for more detailsspikesoptions passed to the axes spikes. See gl-spikes for more detailsclearColora length 4 array of color values for the clearfovythe vertical field of viewzNearnear clip plane distancezFarfar clip plane distancepickRadiusthe distance for mouse pickingautoBoundsa flag, if set automatically recalculates object bounds (defaulttrue)autoScalea flag, if set automatically scales the data set to unit length, preserving aspect ratio (defaulttrue)autoCentera flag, if set translates data to the center of the coordinate system (defaulttrue)clipToBoundsclip data points to remain within the axes boundssnapToDatasnap selections to data pointsonselectcalled whenever the currently highlighted data point changesonrendercalled whenever the scene is drawn
Methods
scene.addObject(obj)
Adds a new object to the scene
scene.removeObject(obj)
Removes an object from the scene
scene.redraw()
Forces an immediate redraw of the scene and pick buffer. Useful if you are s
scene.dispose()
Destroys the scene and releases all associated resources. Also destroys all attached objects.
Properties
scene.selection
Information about the currently selected object in the scene.
scene.objects
A list of all objects in the scene.
scene.canvas
The canvas element associated with the scene
scene.gl
The WebGL context associated with the scene.
scene.axes
A reference to the axes object for the scene
scene.camera
A reference to the camera object for the scene
scene.bounds
Bounds for the scene
Camera Constructor
var camera = require('gl-plot3d').createCamera(element[, options])
Please refer to 3d-view-controls for more info.
https://www.npmjs.com/package/3d-view-controls https://github.com/mikolalysenko/3d-view-controls
License
(c) 2015 Mikola Lysenko. MIT License
Development support by plot.ly