Event-loop-chart
Visualize the lag of the event loop of your Nodejs application.
What is event loop lag?
It is a metric that can help to spot synchronous functions in your Nodejs application. The event loop allows to execute non blocking i/o operations as long as this operations are asynchronous. Please check better explanations of the event loop functionality but in short, there is a queue of operations to be executed, if any of those operations is synchronous like fs.readFileSync('/file.md') the event loop is blocked until the operation is finished. The time that the event loop is blocked is called event loop lag.
How do you use Event-loop-chart?
Install the npm dependency:
npm install event-loop-chartInit the library with data collection interval time and outpug path of the chart:
const elc = require('event-loop-chart');
// set the interval of collection of the event loop lag percentiles for 5000ms
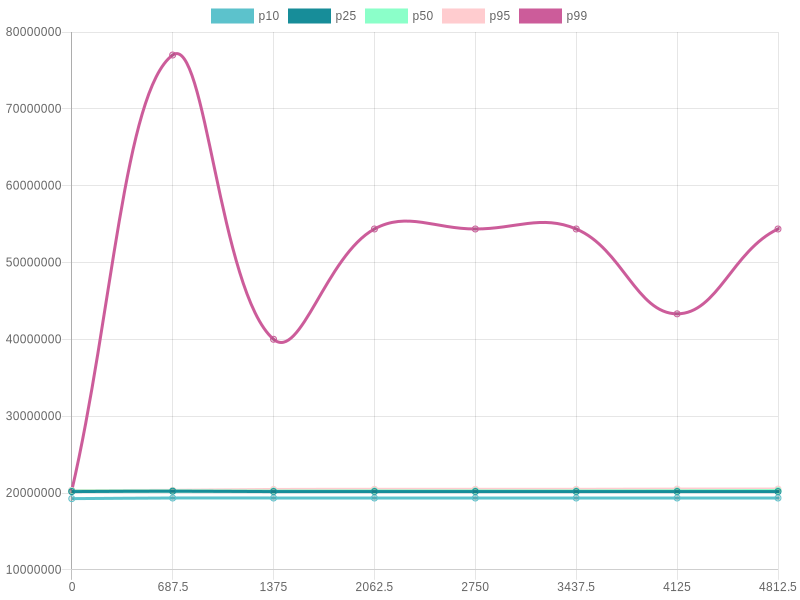
elc.init(5000,"/path/output.png");And that is it! Every 5 seconds, you application will output a line chart with the percentil values p10, p25, p50, p95 and p99.
To trigger a snapshot:
elc.snapshot("/path/output.png");The unit used to measure the lag is nanoseconds. You can have a look at this documentation if you want to know more.