
![]()
![]()


vue-chartjs
vue-chartjs is a wrapper for Chart.js in vue. You can easily create reuseable chart components.
Demo & Docs
Compatibility
- v1 later
@legacy- Vue.js 1.x
- v2 later
- Vue.js 2.x
After the final release of vue.js 2, you also get the v2 by default if you install vue-chartjs over npm. No need for the @next tag anymore. If you want the v1 you need to define the version or use the legacy tag. If you're looking for v1 check this branch
Install
Simply run yarn add vue-chartjs chart.js
Or if you want to use it directly in the browser add
to your scripts. See Codepen
Explanation of Different Builds
There are three different entry points. It depends on which build setup do you have. The dependencies are bundled or required as a peerDependency.
- Browser
- Browserify / Webpack 1
- Webpack 2
| Build | Chart.js |
|---|---|
| vue-chartjs.full.js | Bundled |
| vue-chartjs.full.min.js | Bundled |
| vue-chartjs.js | peerDependency |
| vue-chartjs.min.js | peerDependency |
| es/index* | peerDependency |
Browser
You can use vue-chartjs directly in the browser without any build setup. Like in this codepen. For this case, please use the vue-chartjs.full.min.js which is the minified version. It has Chart.js bundled into it. And bundled to a UMD Module. So you only need that one file.
You can then simply register your component:
VueBrowserify / Webpack 1
If you're using Gulp, Browserify or Webpack 1 the entry is vue-chartjs.js which is transpiled and bundled UMD Module.
However Chart.js is a peerDependencies so you have to install it separately. In most projects This way, you can have different versions of Chart.js then in this package.
Webpack 2
If you're using Webpack 2 it will automatically use the jsnext:main / module entry point. Which is es/index.js
It is a transpiled es version of the source. And is not bundled to a module. This way you three shaking will work. Like in the bundled version, Chart.js is a peerDependencies and need to be installed.
How to use
You need to import the component and then either use extends or mixins and add it.
You can import the whole package or each module individual.
Just create your own component.
// CommitChart.js extends: Bar { // Overwriting base render method with actual data. this }Then simply import and use your own extended component and use it like a normal vue component
Another Example with options
You can overwrite the default chart options. Just pass the options object as a second paramenter to the render method
// MonthlyIncome.vue extends: Line props: 'data' 'options' { this }Use it in your vue app
<template> <monthly-income :data=... /></template> <script> components: MonthlyIncome ...</script>Reactivity
Chart.js does not update or re-render the chart if new data is passed. However you can simply implement this on your own or use one of the two mixins which are included.
reactivePropreactiveData
Both are included in the mixins module.
The mixins automatically create chartData as a prop or data. And add a watcher. If data has changed, the chart will update.
However keep in mind the limitations of vue and javascript for mutations on arrays and objects. More info here
// MonthlyIncome.js extends: Line mixins: mixinsreactiveProp props: 'chartData' 'options' { this } Mixins module
The mixins module is included in the VueCharts module and as a seperate module.
Some ways to import them:
// Load complete module with all charts extends: VueChartsLine mixins: VueChartsmixinsreactiveProp props: 'chartData' 'options' { this }// Load speperate modules extends: Line mixins: mixinsreactiveProp props: 'chartData' 'options' { this }// Load speperate modules with destructure assignconst reactiveProp = mixins extends: Line mixins: reactiveProp props: 'chartData' 'options' { this }Available Charts
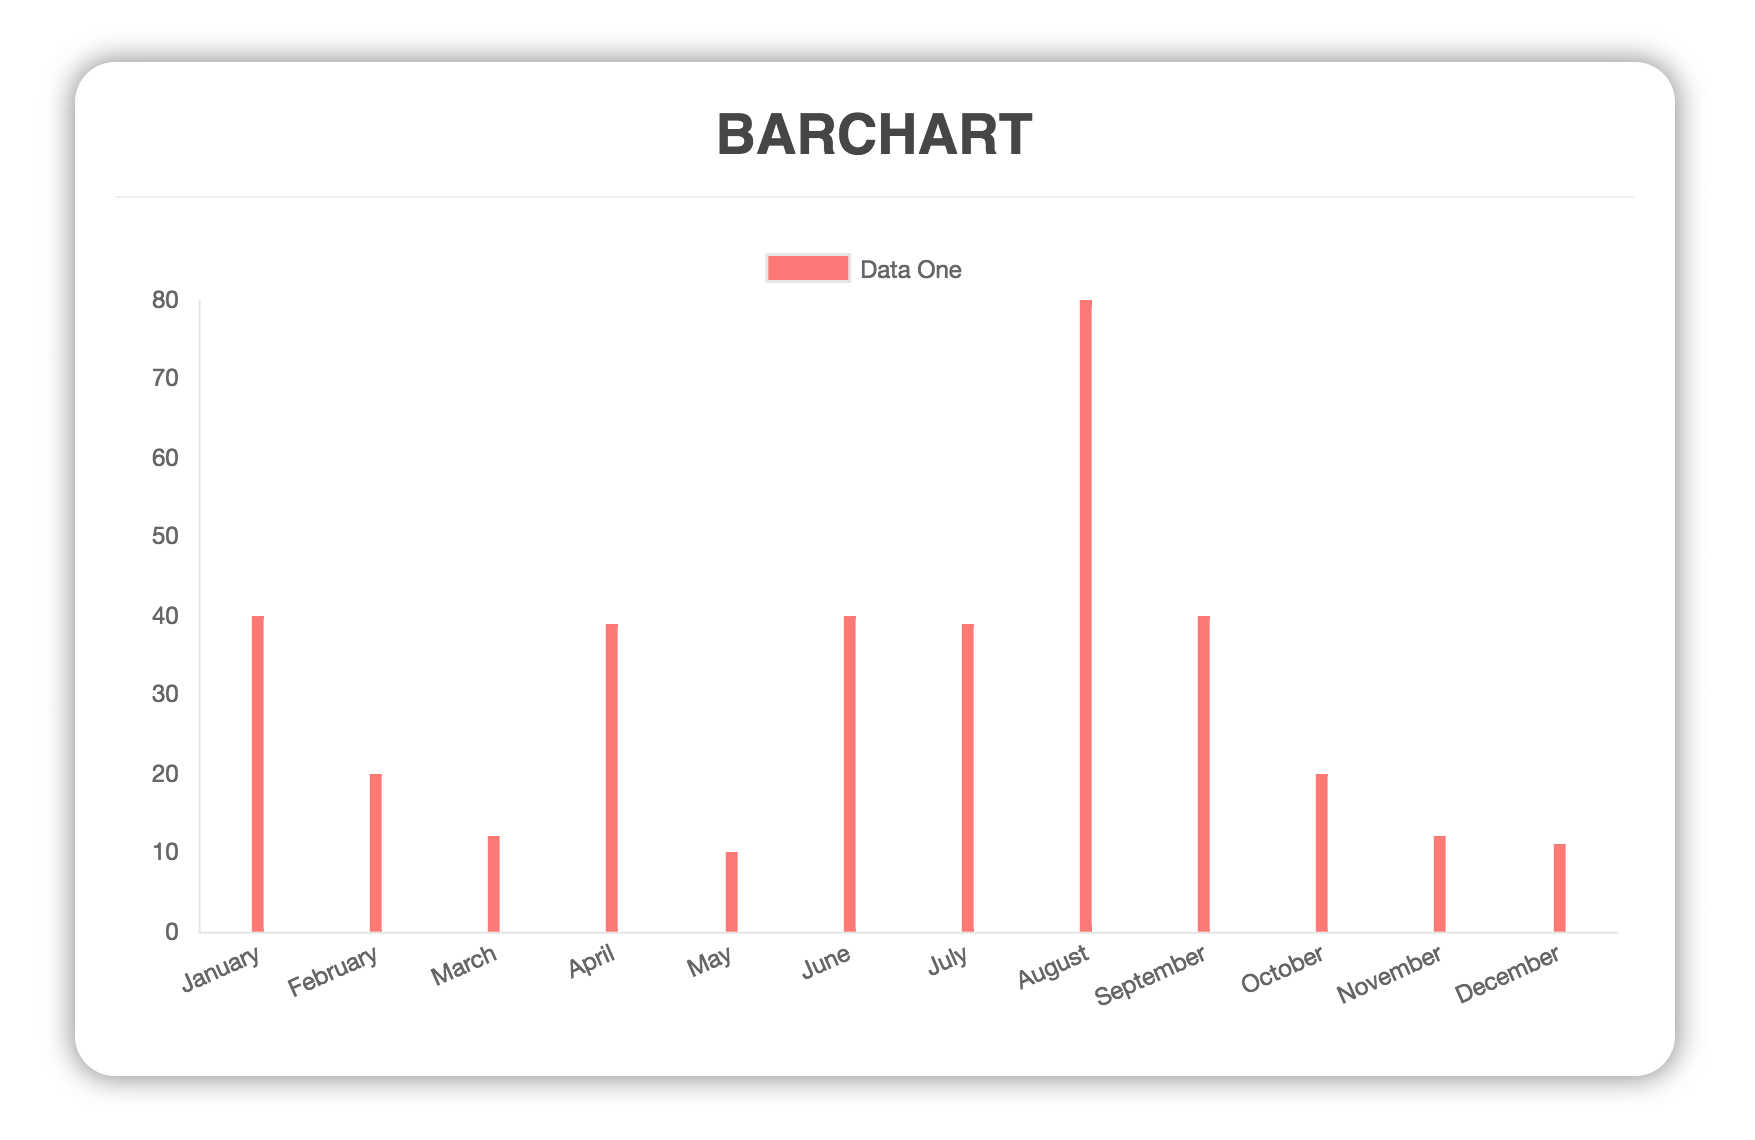
Bar Chart
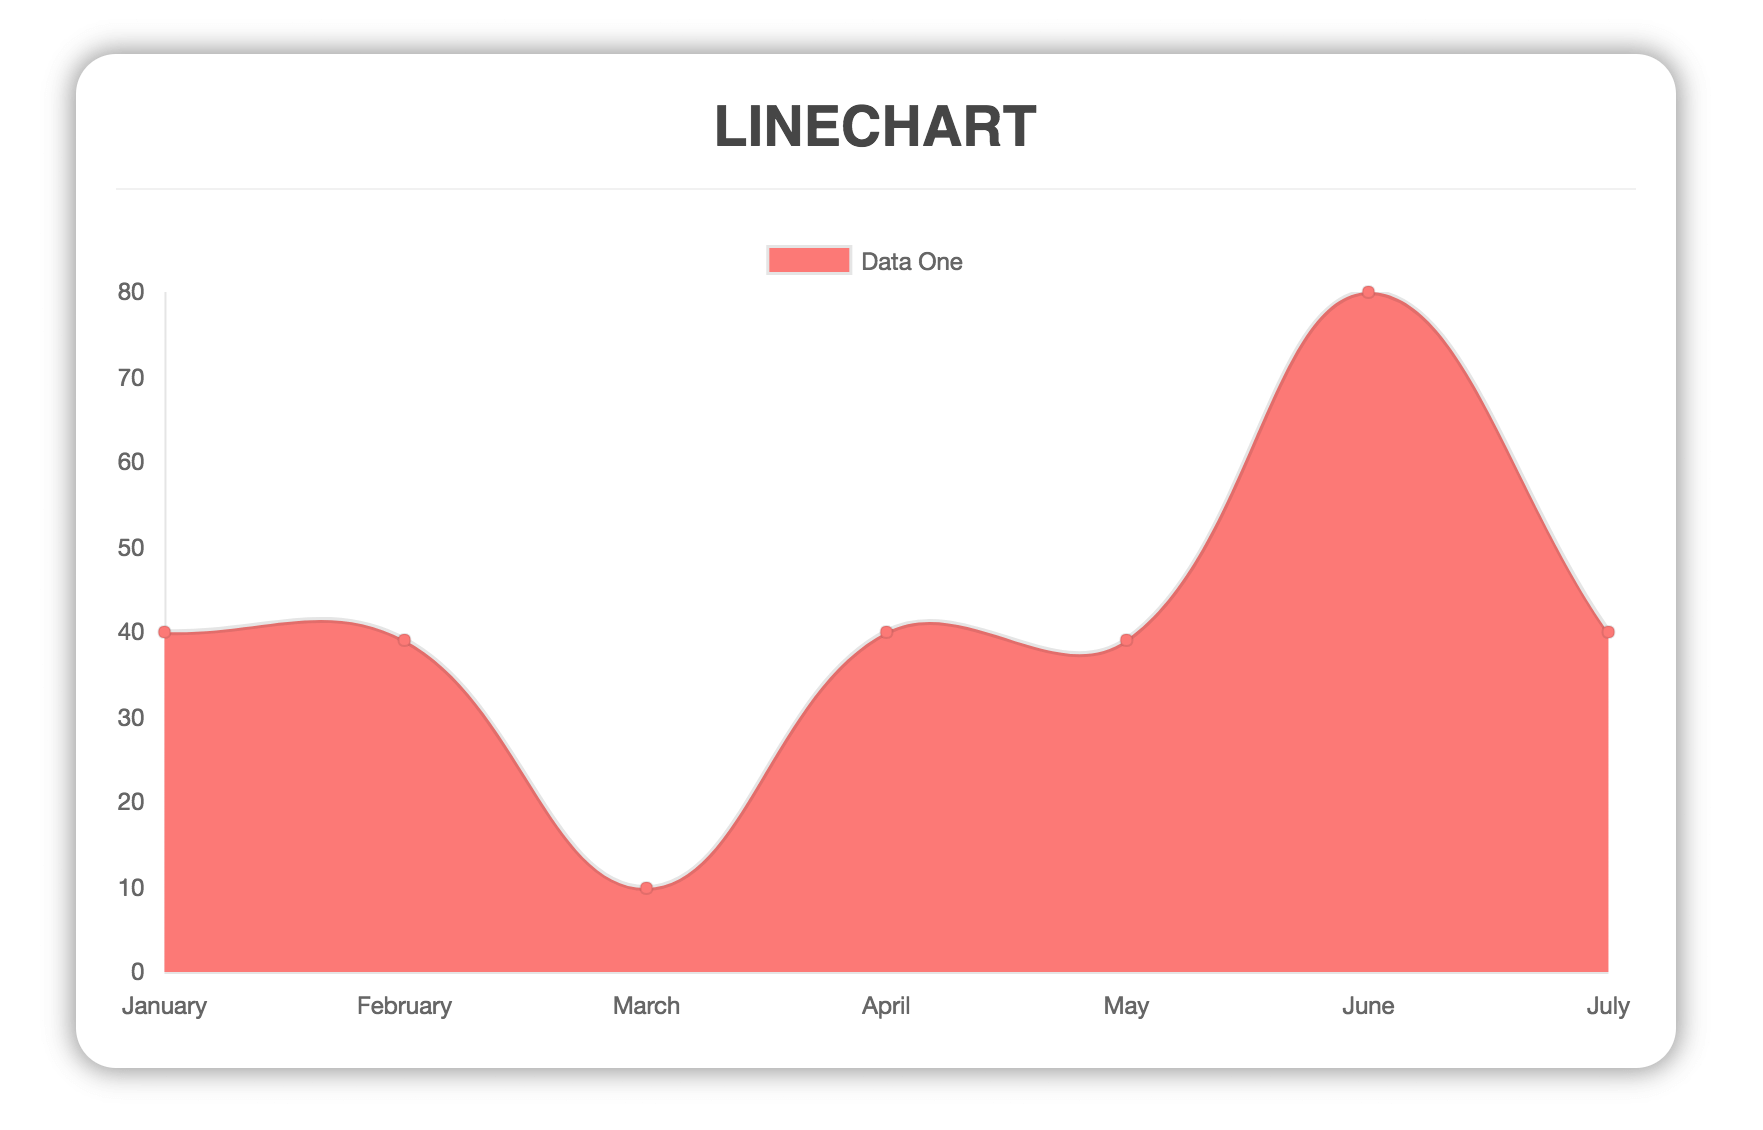
Line Chart
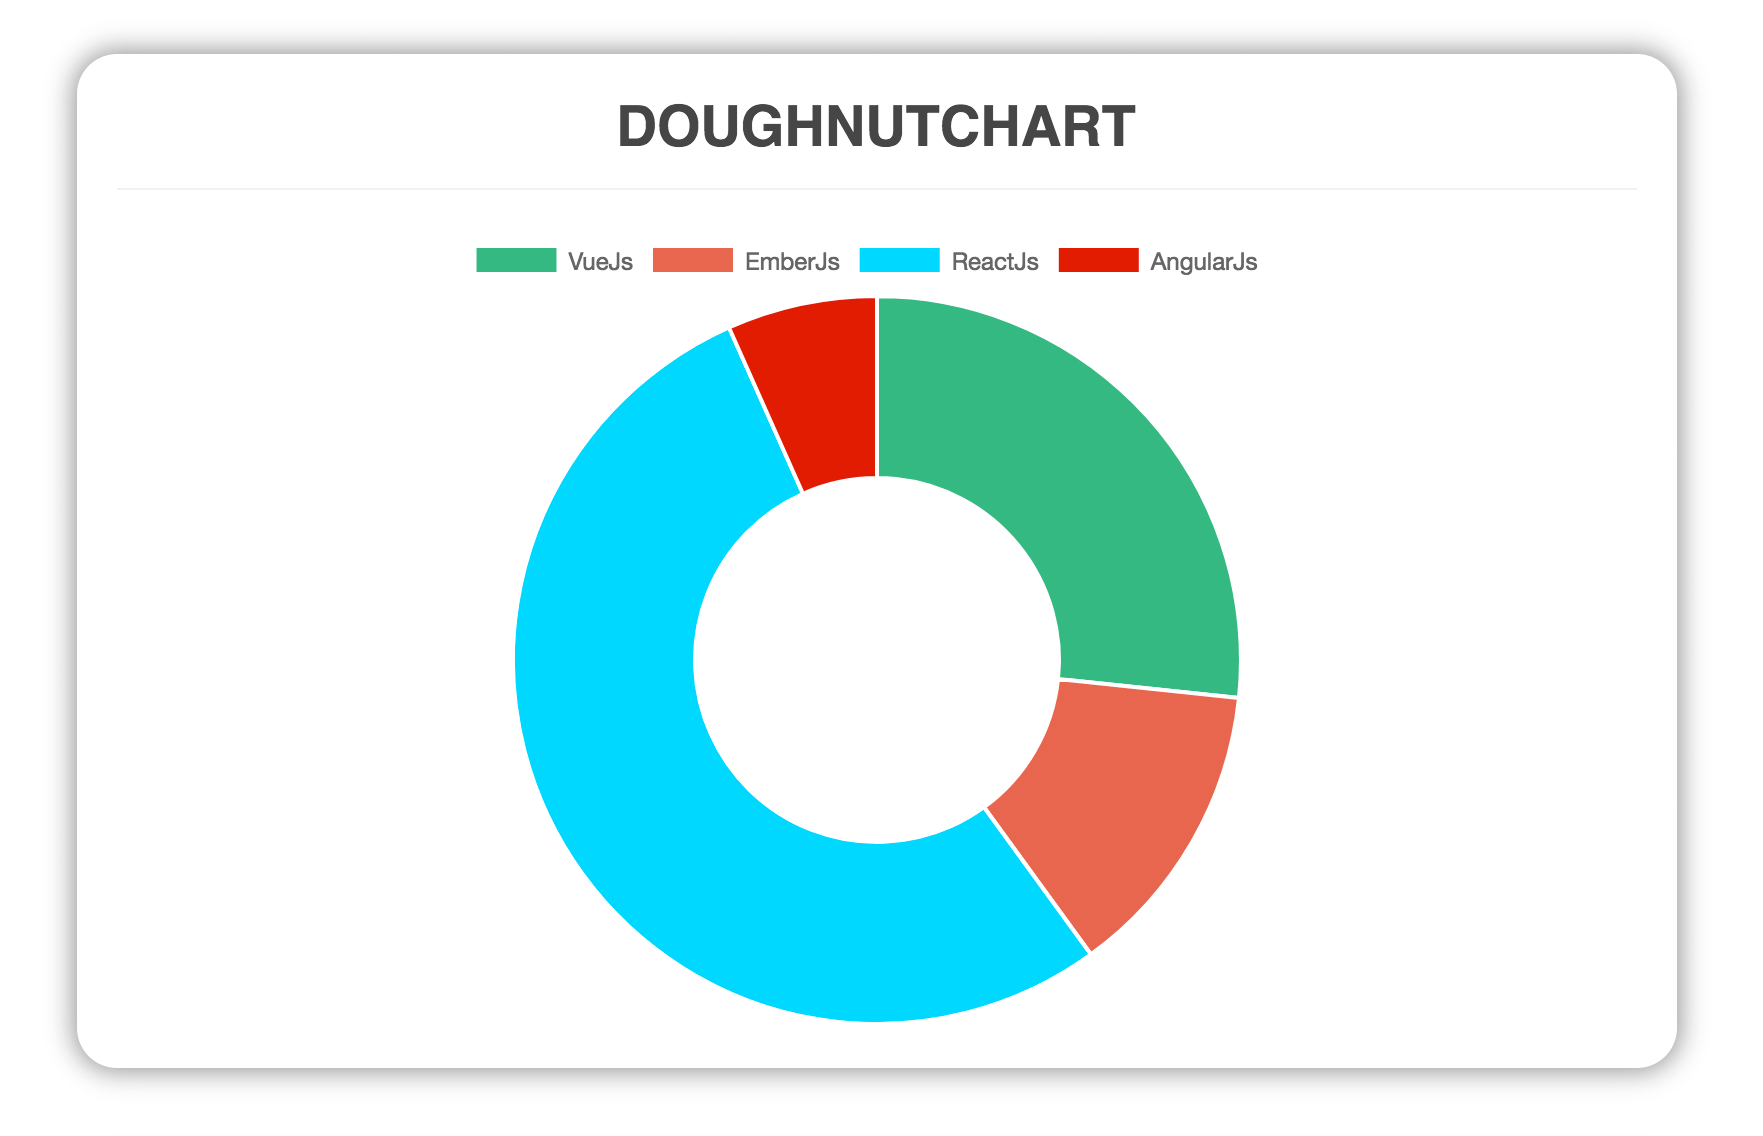
Doughnut
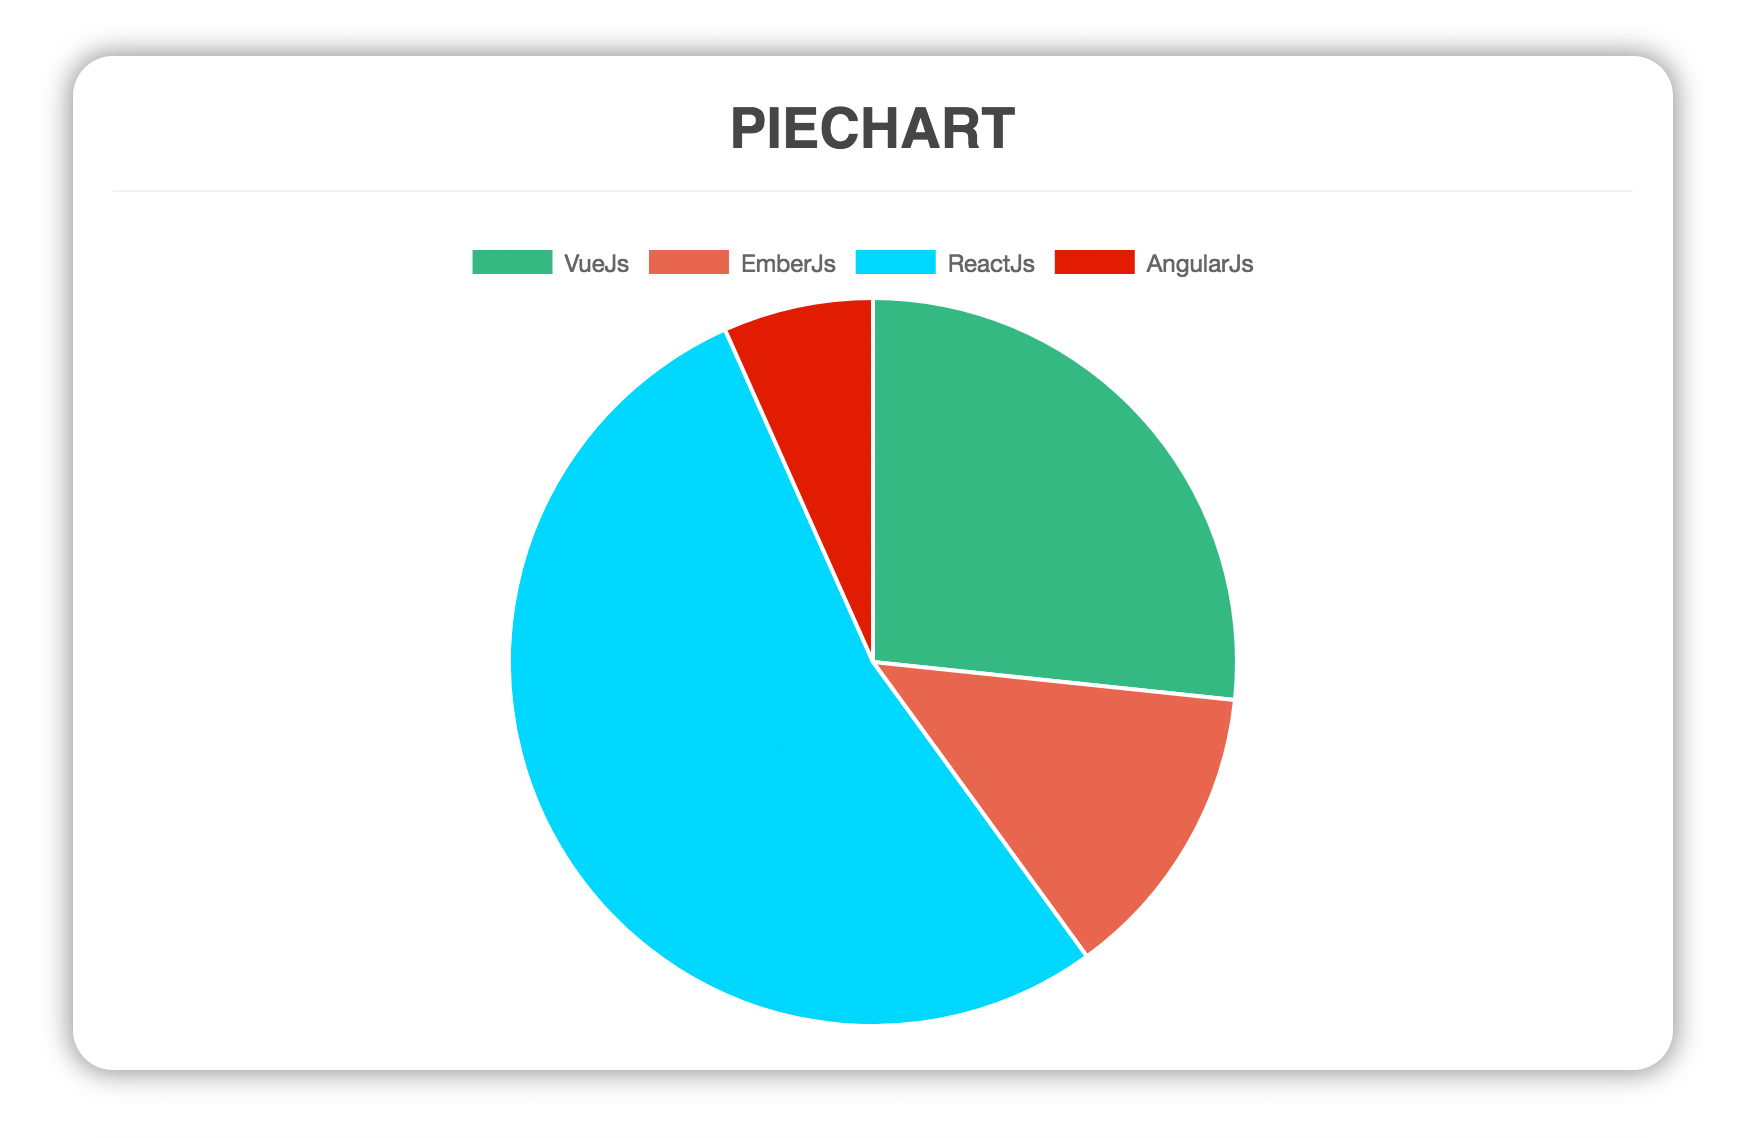
Pie
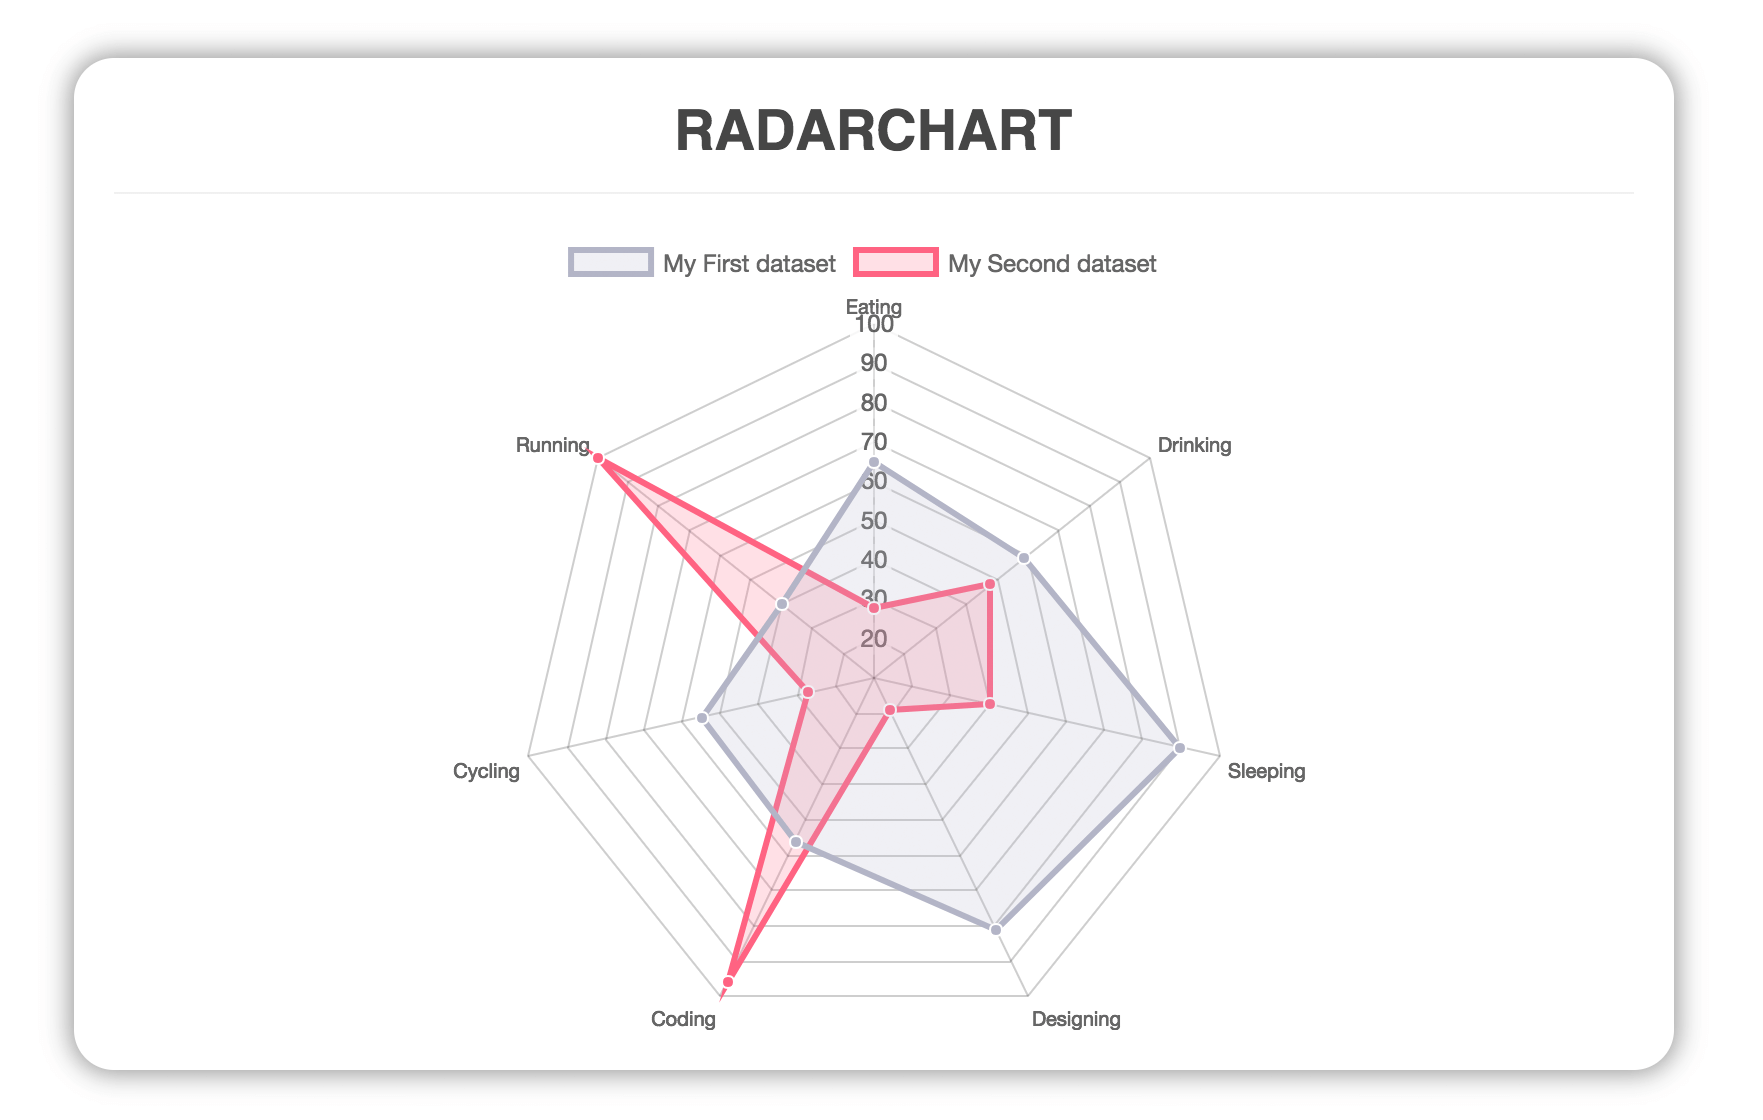
Radar
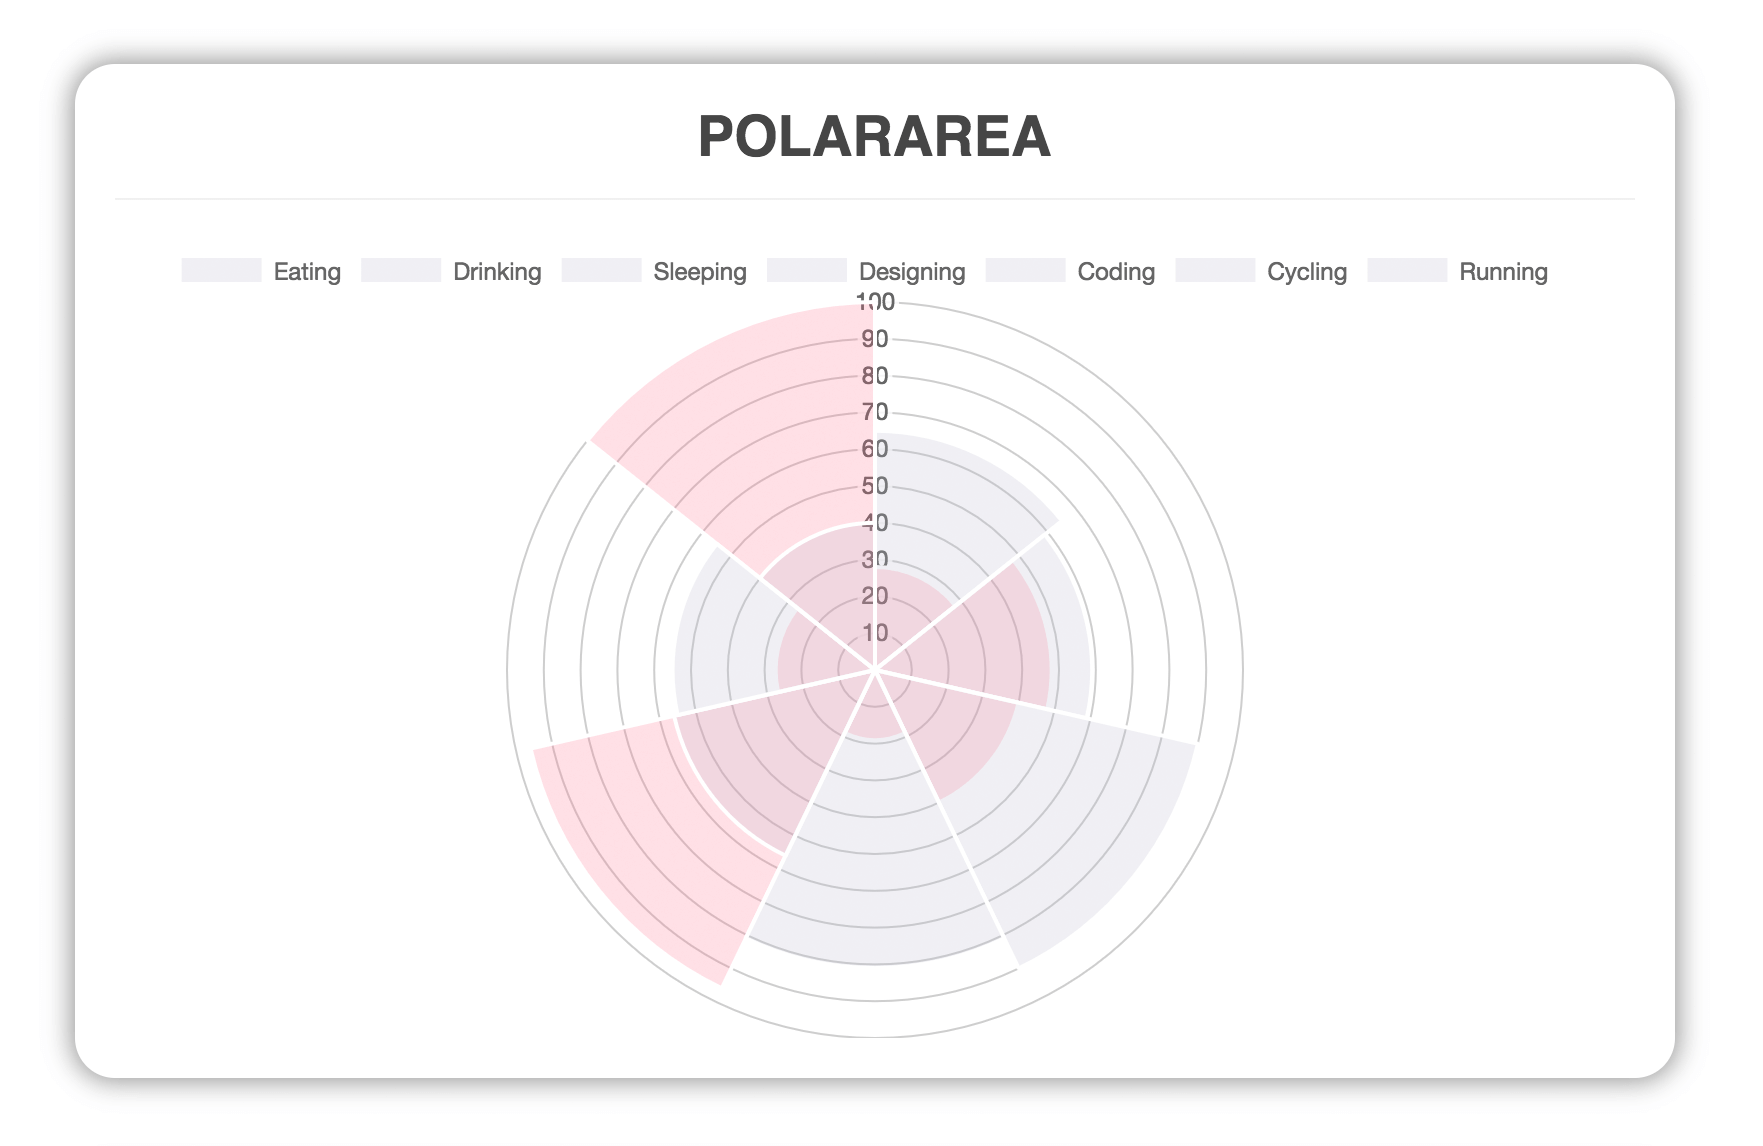
Polar Area
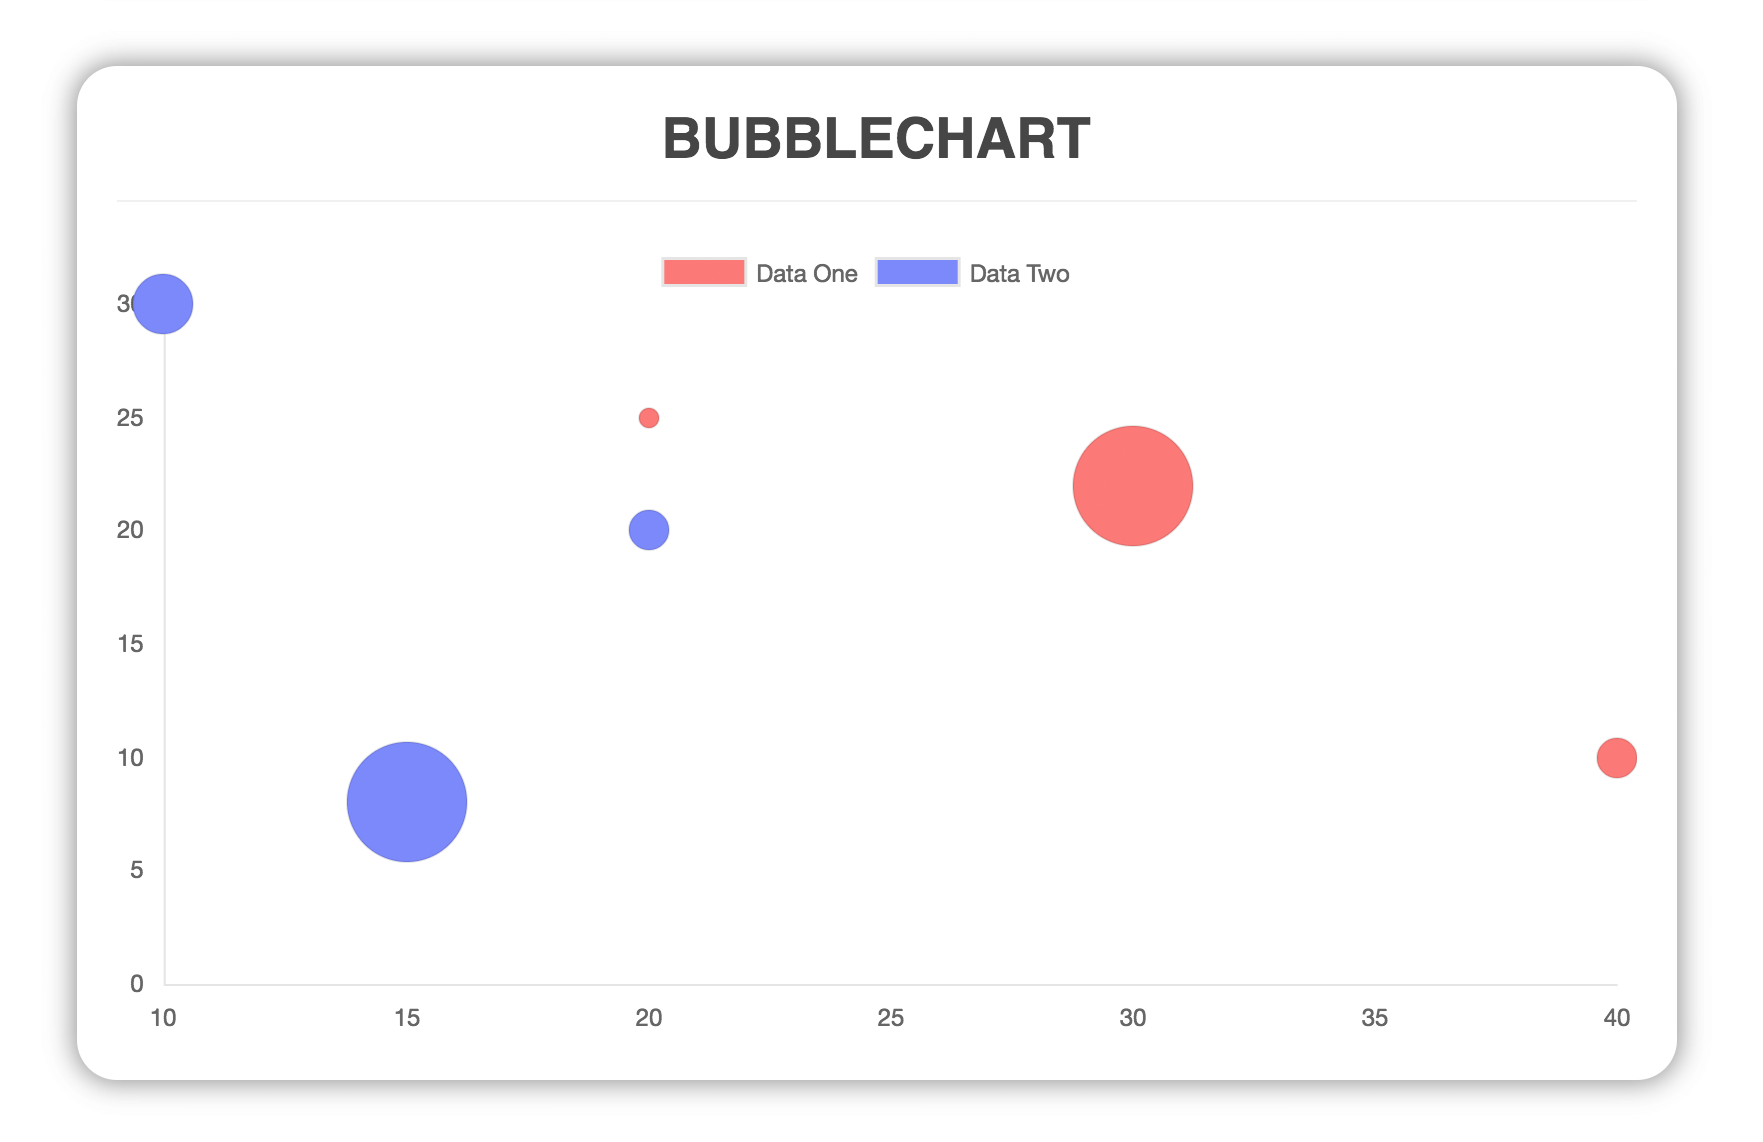
Bubble
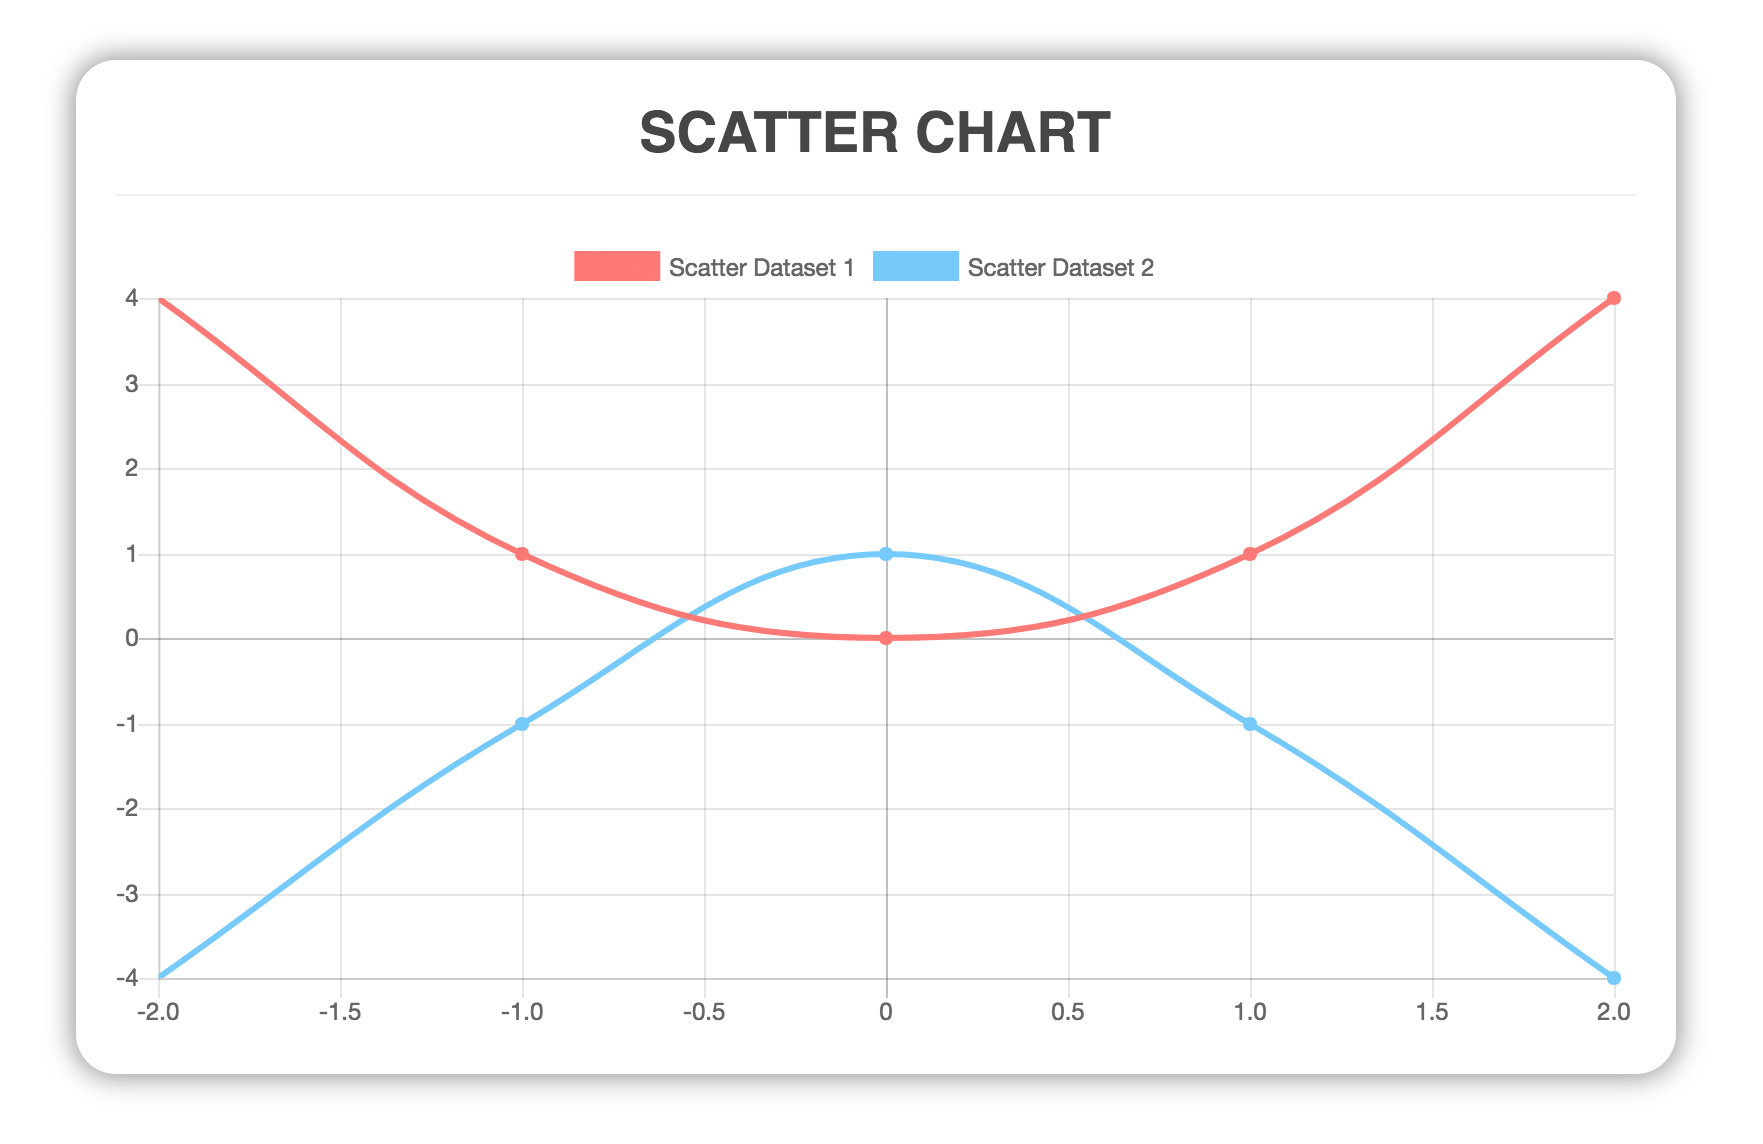
Scatter
Build Setup
# install dependenciesnpm install# serve with hot reload at localhost:8080npm run dev# build for production with minificationnpm run build# run unit testsnpm run unit# run e2e testsnpm run e2e# run all testsnpm test
For a detailed explanation on how things work, check out the guide and docs for vue-loader.
Contributing
- Fork it ( https://github.com/apertureless/vue-chartjs/fork )
- Create your feature branch (
git checkout -b my-new-feature) - Commit your changes (
git commit -am 'Add some feature') - Push to the branch (
git push origin my-new-feature) - Create a new Pull Request
License
This software is distributed under MIT license.