ember-perf-timeline 
Add performance information to Chrome's Timeline for Ember applications.
Currently this addon provides information for Component and {{outlet}} render, although more support can (and should) be added in the future.
Warning: Running with the profiler and instrumentation enabled will itself impede performance itself. Also, be sure to test in production mode or all the development mode assertions will affect performance as well.
Installation
ember install ember-perf-timeline
Usage
- Add
_ember-perf-timeline=trueto the queryString of your URL. - Record a timeline (using either timeline tab or performance tab in Chrome).
Note: If the query param is not set, the addon will not impact your app's performance, and can be left installed for production. Additionally, if the query param is set, the instrumentation overhead may be non-trivial.
Configuration
The _ember-perf-timeline query param can be either true or a , separated list.
For example, ?_ember-perf-timeline=render.component,render.outlet will enable instrumentation for render.component and render.outlet but ignoring other available instrumentations. ?_ember-perf-timeline=true will enable all available instrumentations.
You can also configure your app's environment to always enable instrumentations in development mode. This can prevent route transitions clearing the queryParam.
module { let ENV = // ... ; if environment === 'development' ENVemberPerfTimeline = renderComponent: true renderOutlet: true renderGetComponentDefinition: true if environment === 'production' return ENV;};Containment
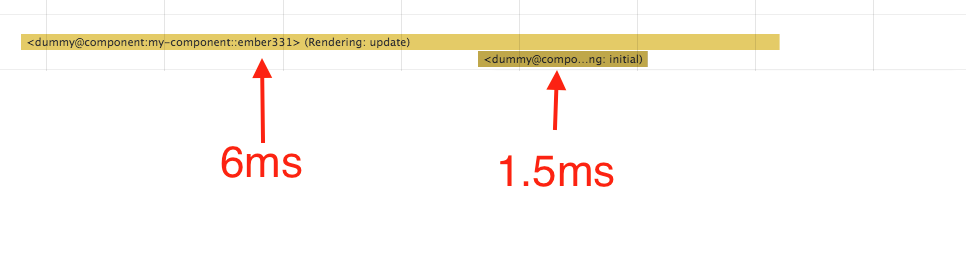
Times for a given component include its own time and those of its children. For the following example, the parent component took a total of 6 ms, which includes the 1.5ms of the child:
Example
- Run
ember sin this repo. - Visit http://localhost:4200/?_ember-perf-timeline=true.
- Open "Timeline" or "Performace" tab in the Chrome Developer Tools.
- Record a timeline.
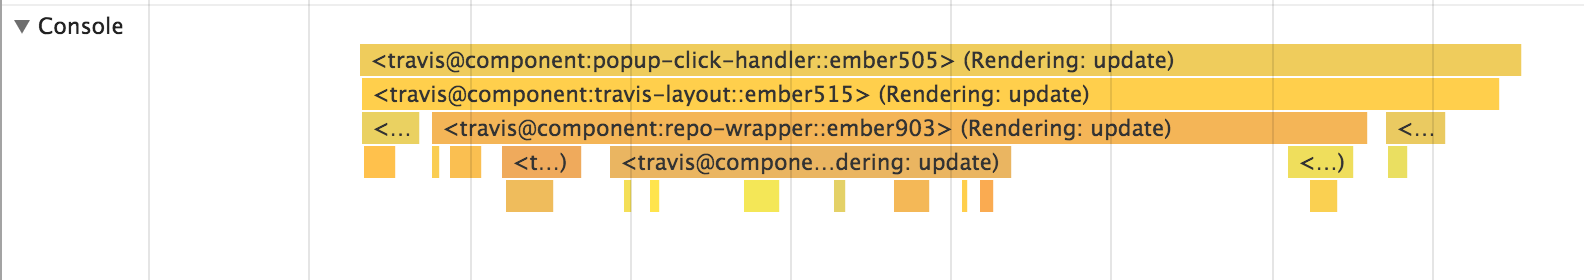
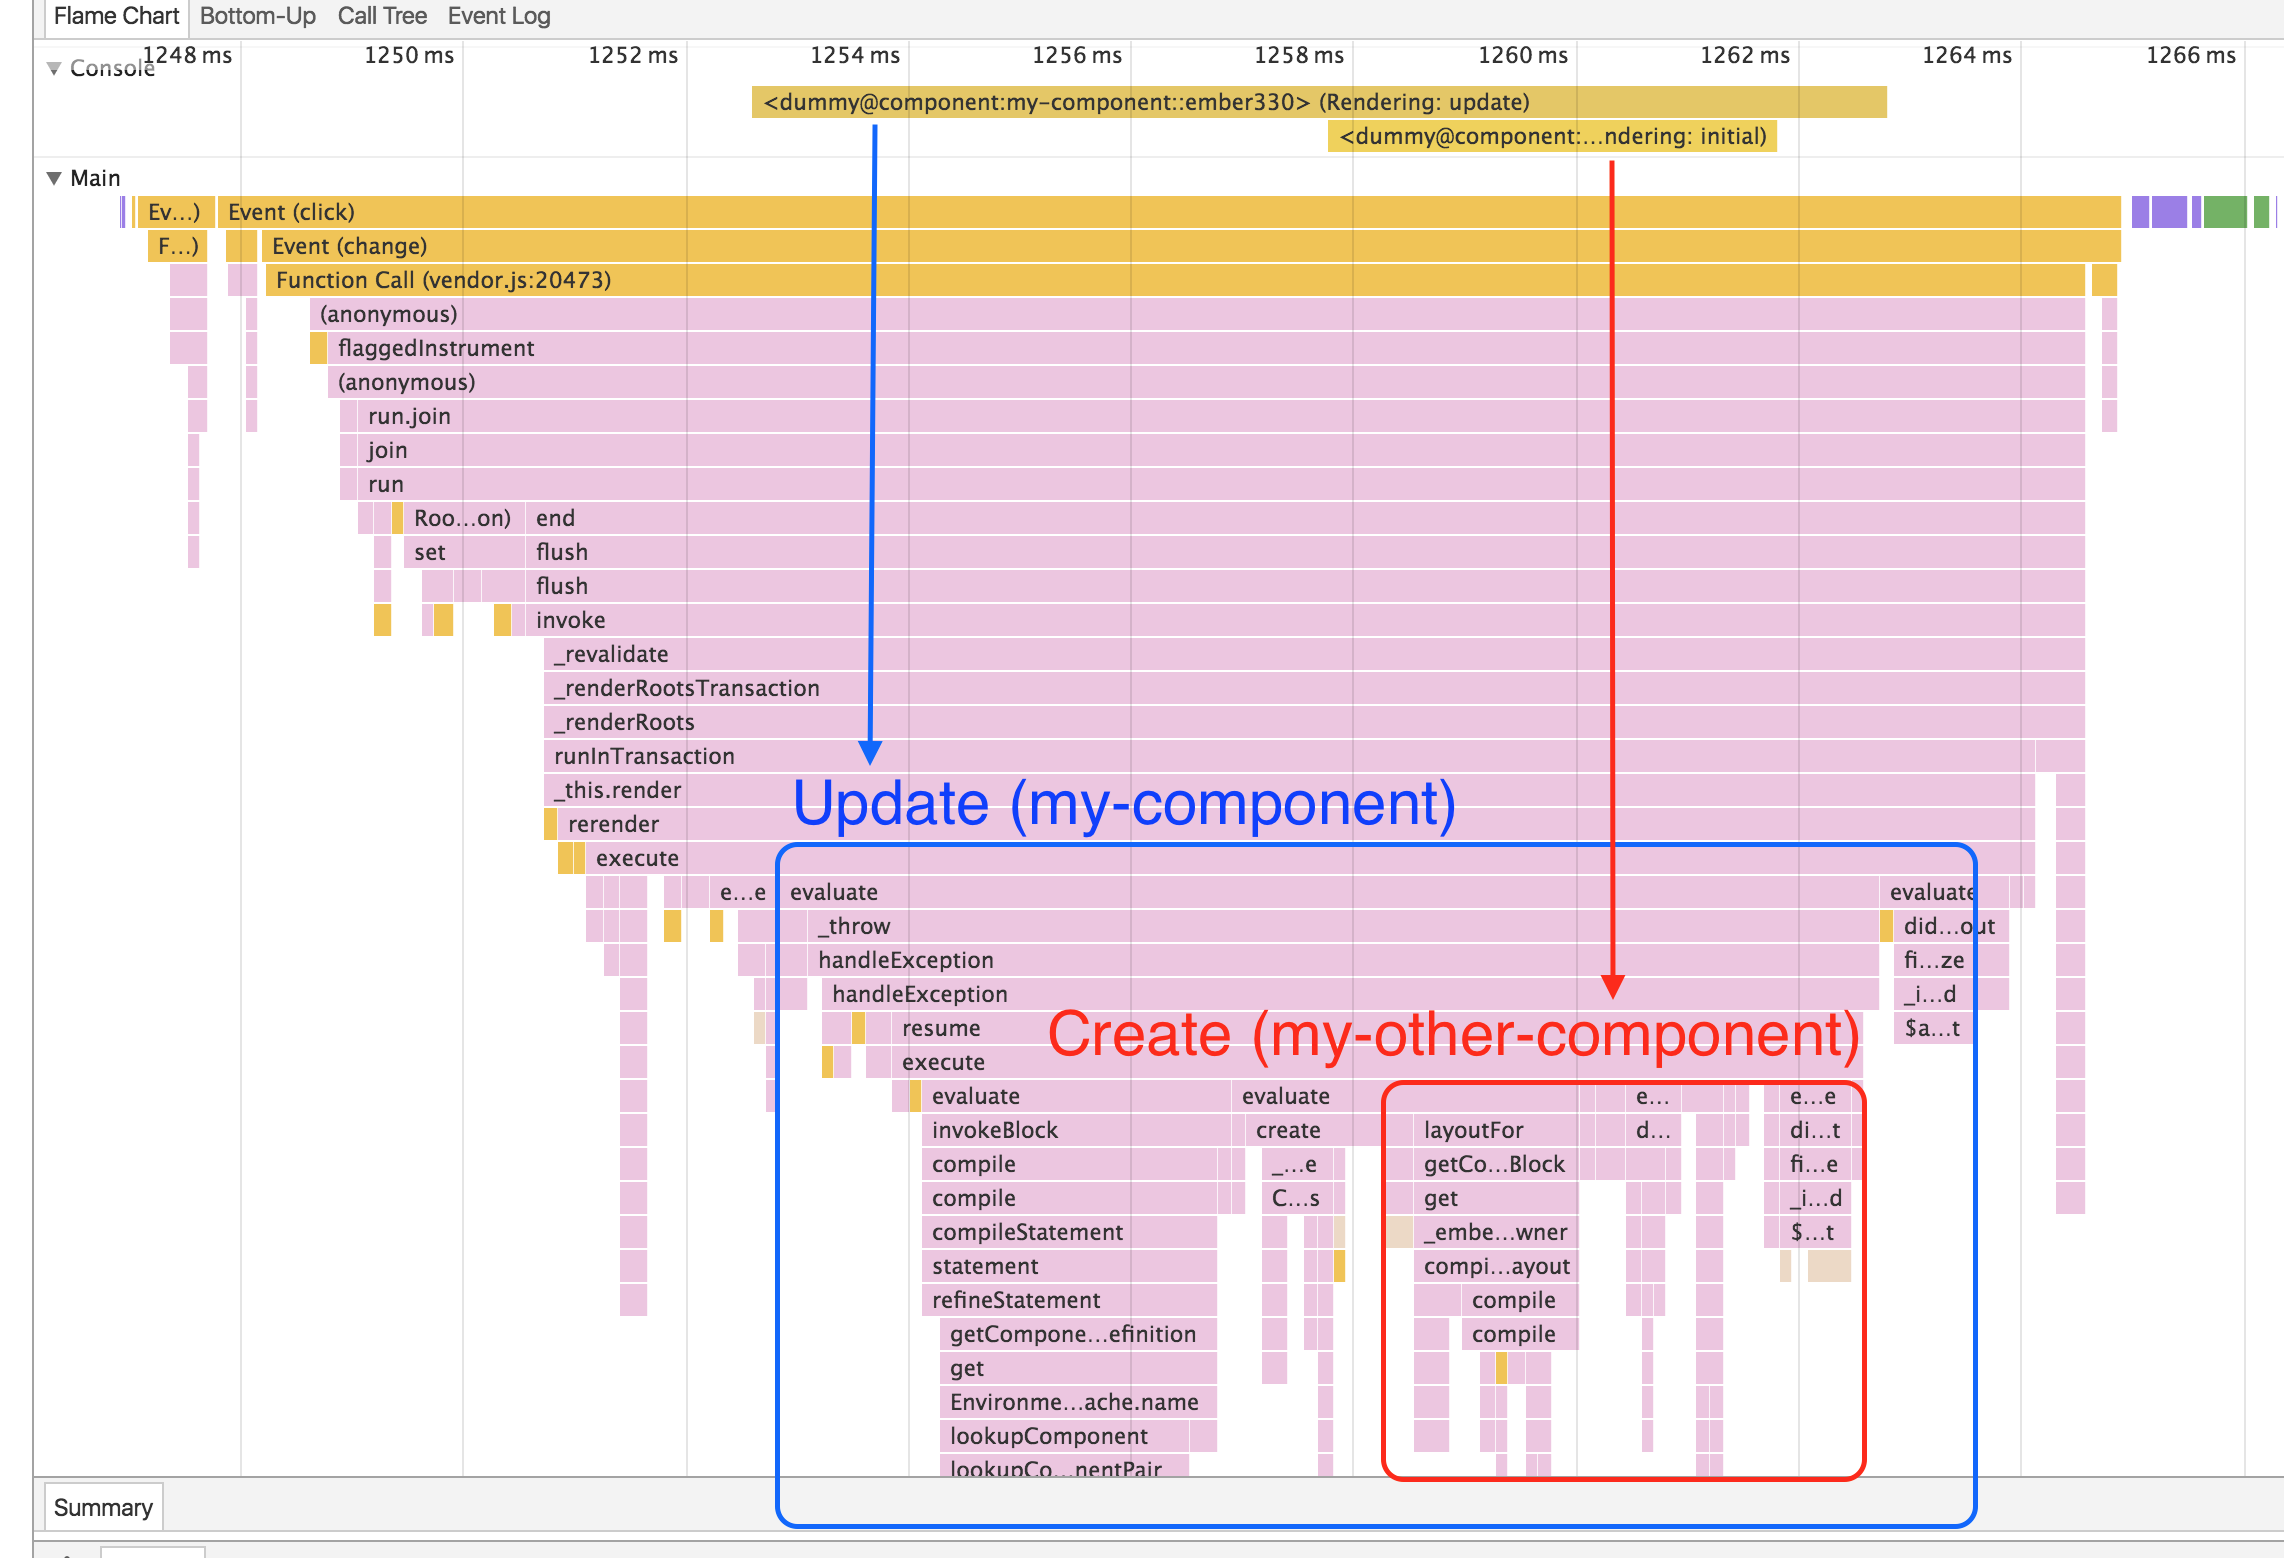
- You will see something like:
What else can you do?
- You can search by the name of your component:
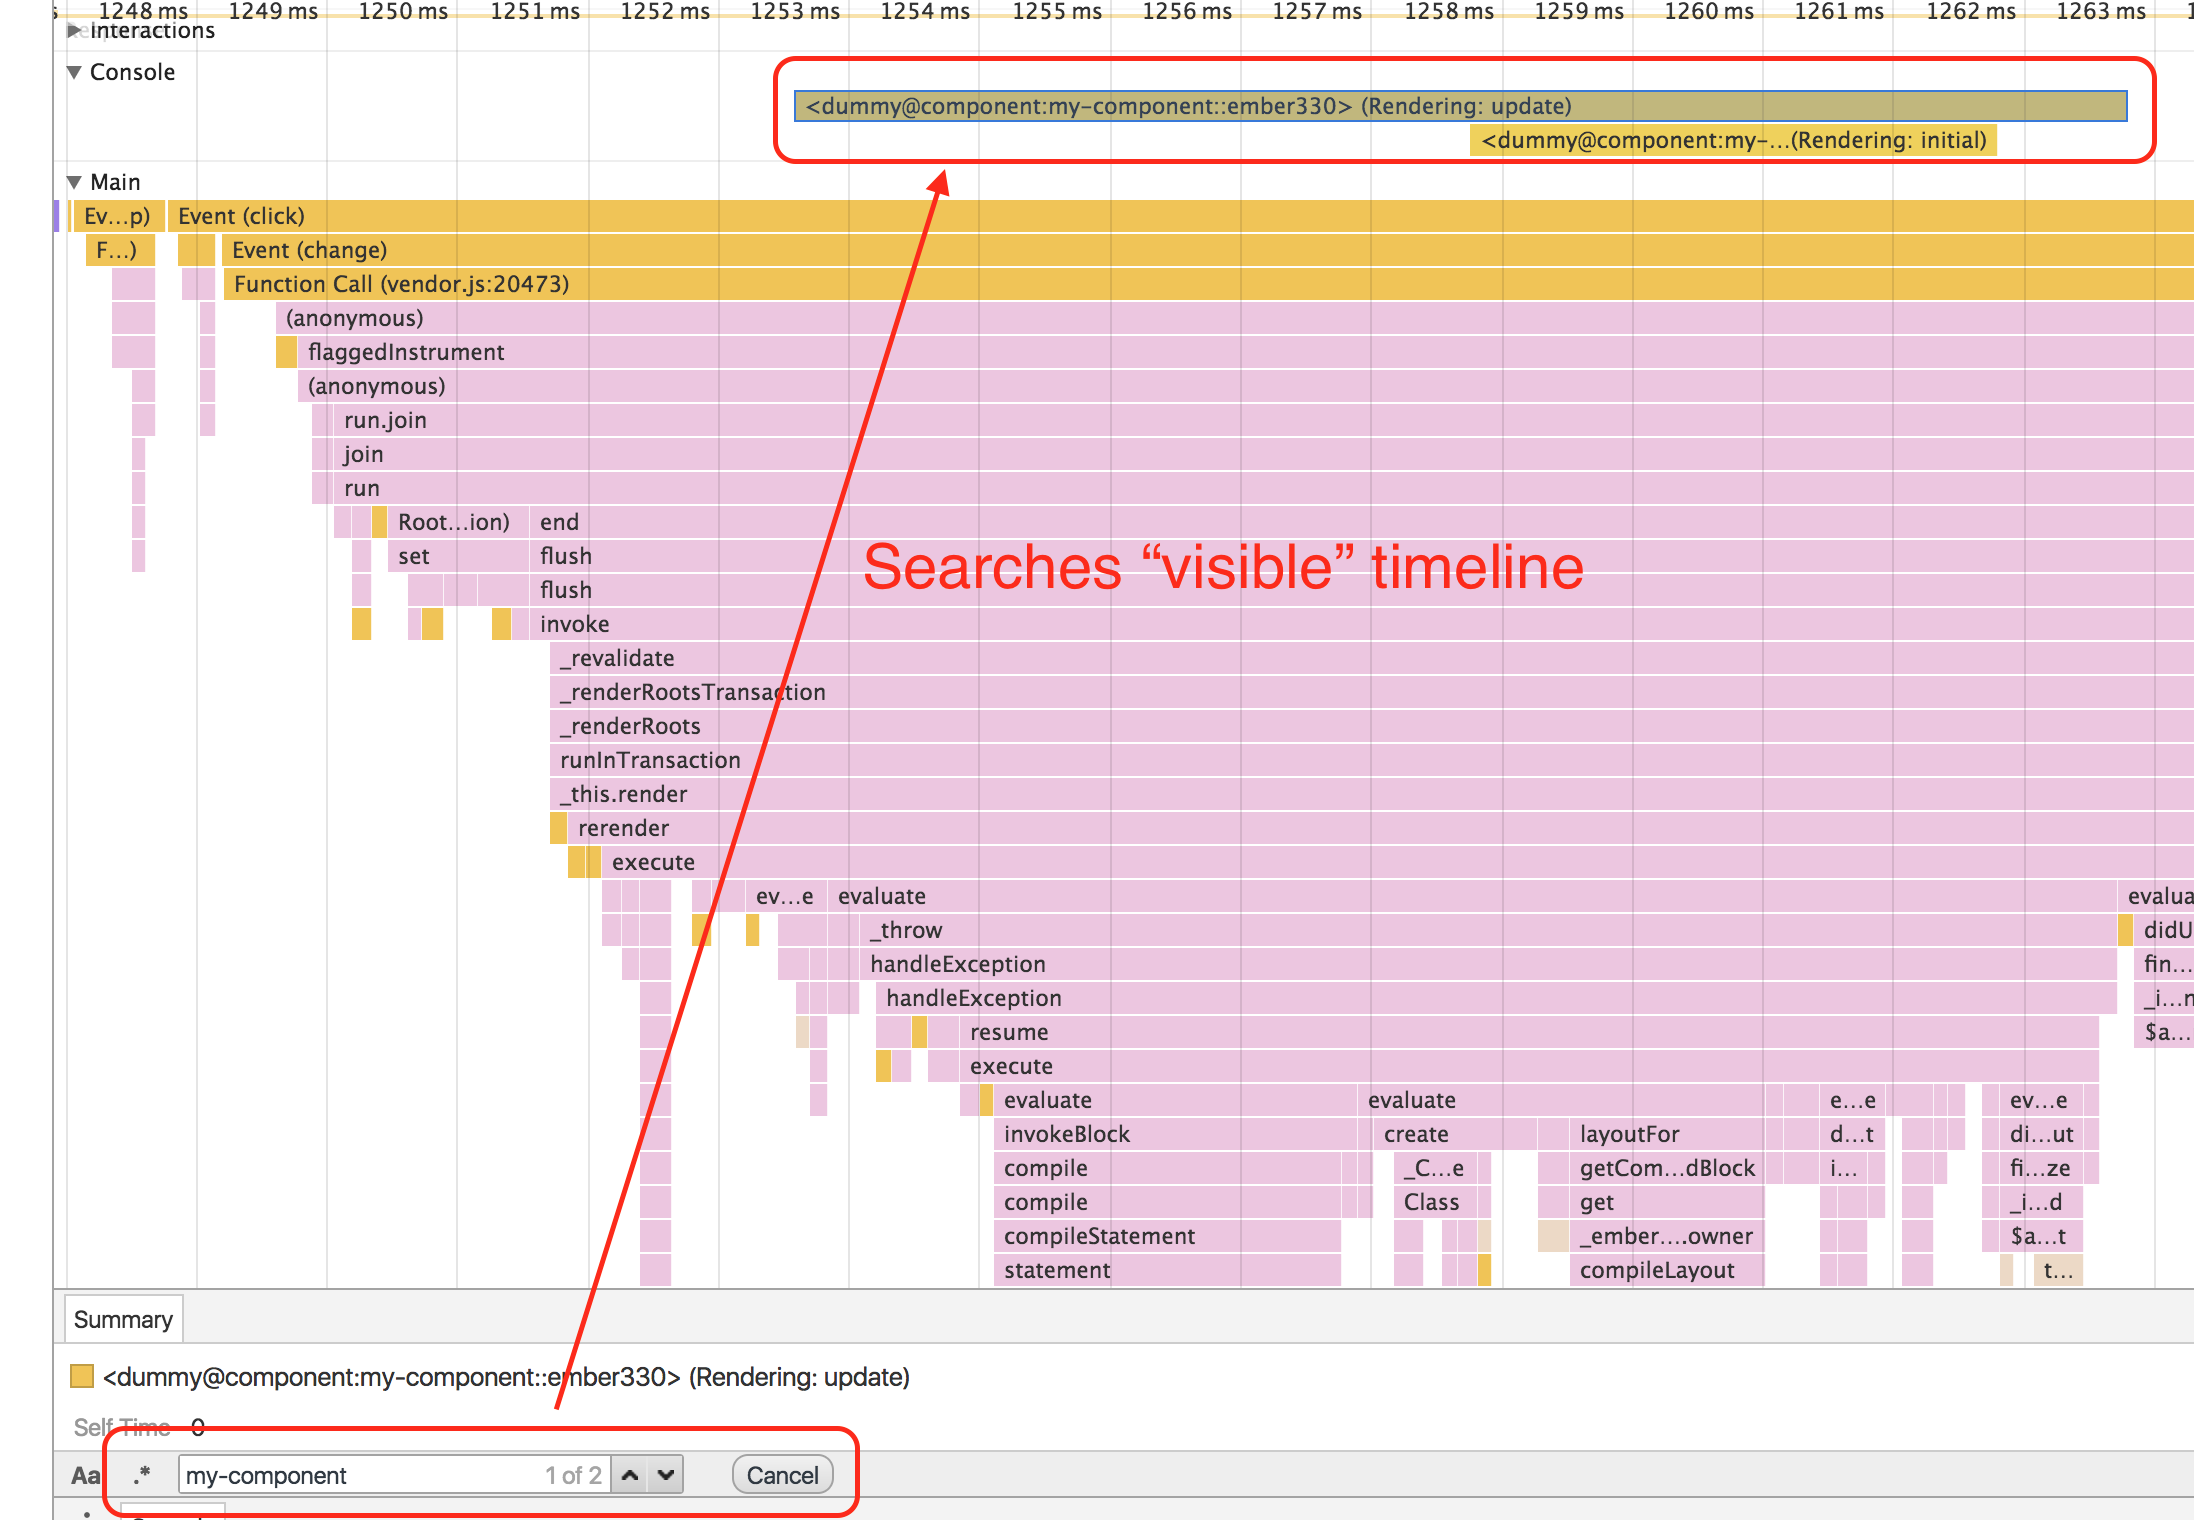
- You can search for both
$beforeRenderComponentand$afterRenderComponent, to find the bounds of component renderings within the flame graph:
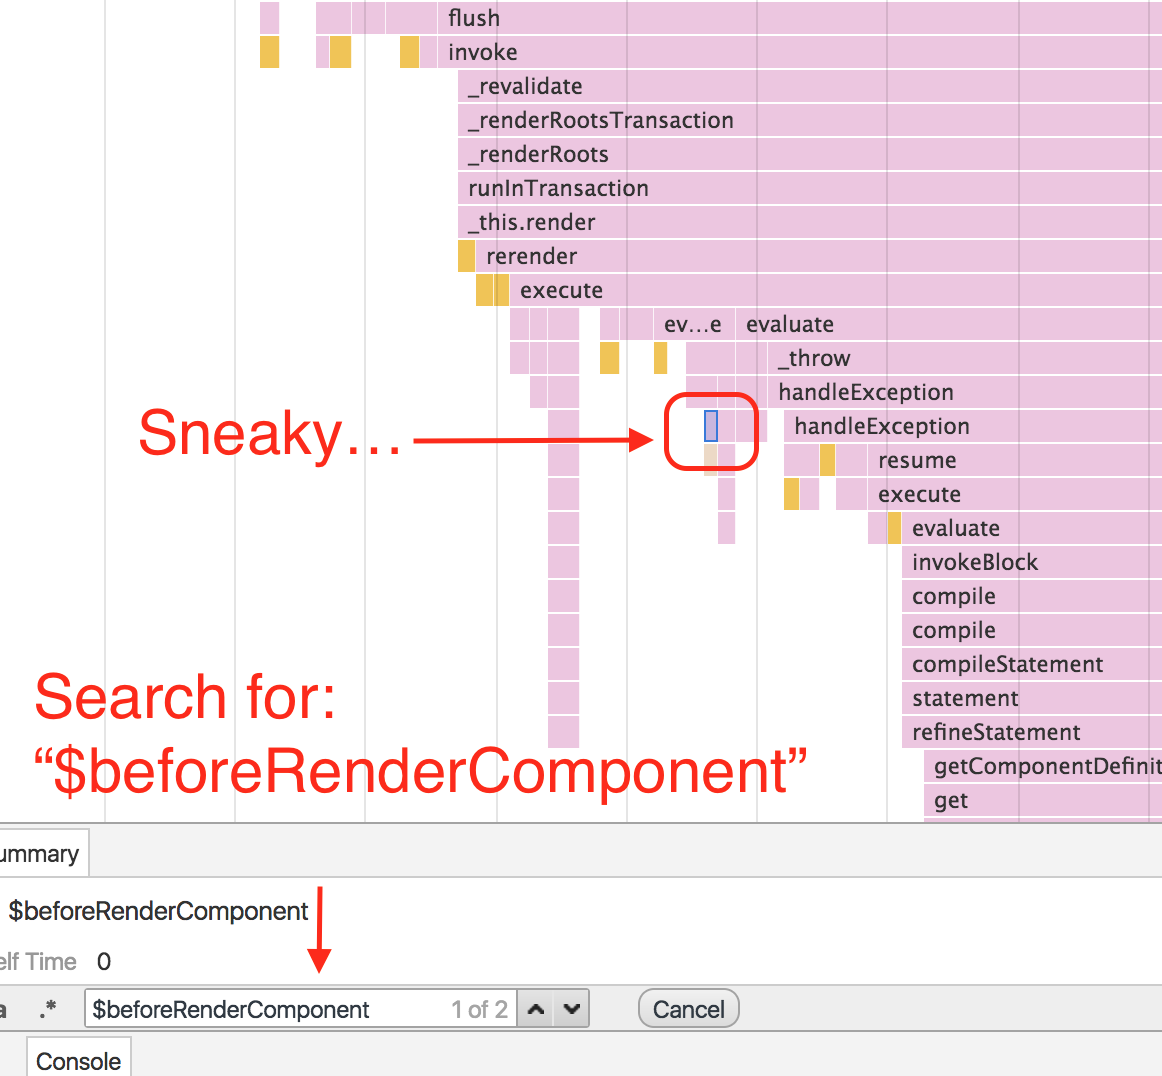
Note: Searching is limited to the visibile portion of the timeline.
Developement
Running
ember serve- Visit your app at http://localhost:4200.
Running Tests
npm test(Runsember try:eachto test your addon against multiple Ember versions)ember testember test --server
Building
ember build
For more information on using ember-cli, visit https://ember-cli.com/.