
Dialogflow Agent Visualization Tool
When developing a Dialogflow agent, have you ever drawn a diagram of intents trying to create a good conversational experience for your app? I certainly have. I would later transform this hand-drawn diagram into a Dialogflow agent, hoping I didn’t make mistakes. What if there was a way to see how intents are connected in your Dialogflow agent?
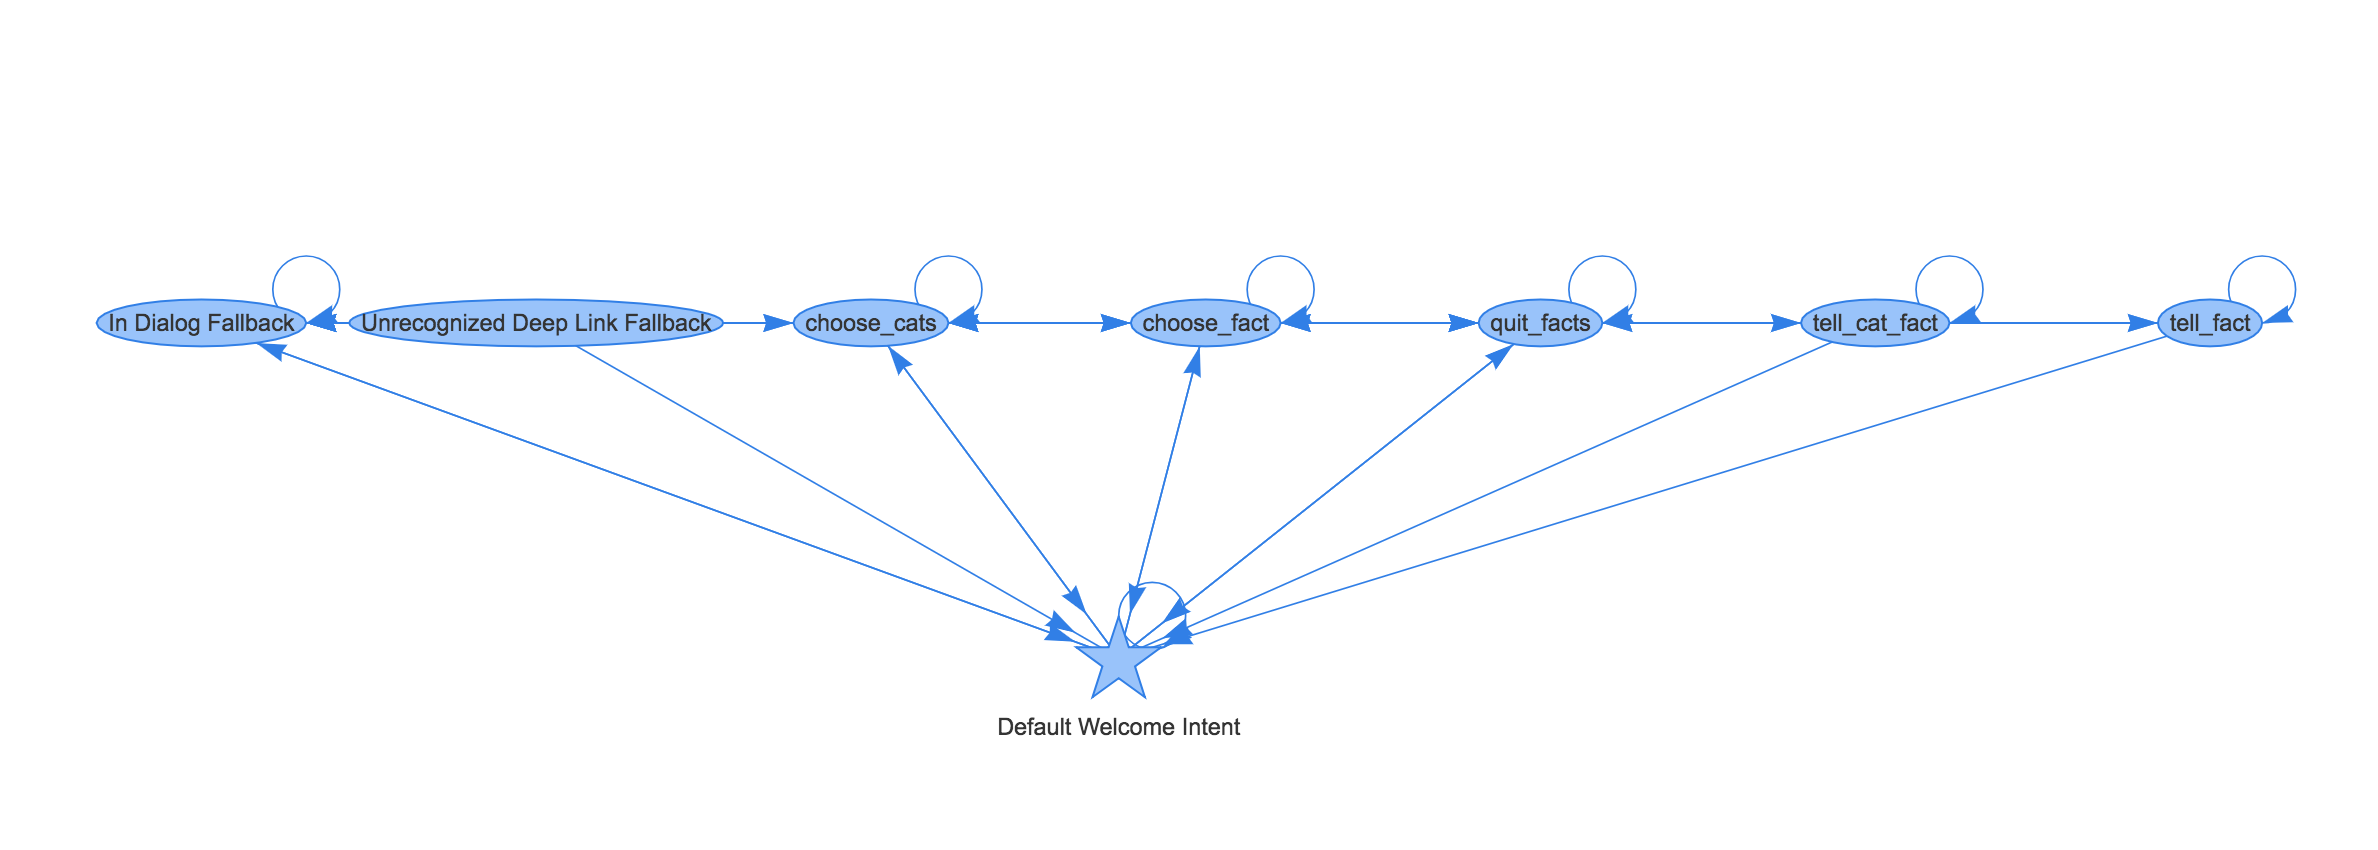
The Dialogflow Agent Visualization Tool, i.e. dfvis, allows you to display your Dialogflow agent as an HTML rendered graph, where nodes are the intents and edges exists if it’s possible to go from intent A to intent B during a conversation.
The software is currently in alpha
Limitations
- Works only with agents whose primary language is English
- Doesn’t properly connect nodes that set output context in a fulfillment webhook.
How to get started
dfvis is a command-line tool that you can install via NPM:
npm install -g dfvis
Then,
dfvis /path/to/dialogflow-agent-folder/ -o /path/to/output/file
dfvis takes a path to a folder containing Dialogflow agent that can be obtained from Dialogflow console by selecting “Import as ZIP”. Note, you will need to unzip the downloaded file.
See full help message below,
$ dfvis -h
usage: dfvis [-h] [-v] [-o OUT] file

DialogFlow visualizing software

Positional arguments:
  file               Path to a folder with DialogFlow agent.

Optional arguments:
  -h, --help         Show this help message and exit.
  -v, --version      Show program's version number and exit.
  -o OUT, --out OUT  Name of the file where to redirect the output.
How it works
The tool parses intents from agent/intents/ folder of a Dialogflow agent. Then, the graph is created where edge (A,B) exists between intent A and intent B if and only if one of the following cases is satisfied:
- B doesn’t have any input contexts
- Set of output contexts of A contains is a superset of input contexts of B
The resulted graph is then rendered into HTML usingvis.js link as the visualization engine.
Examples
See examples folder for generated HTML files for the following open-source samples:
- official Actions on Google sample “Number Genie”
- official Actions on Google sample “Facts About Google”
License
This software is Copyright 2018, Aza Tulepbergenov, and available under MIT license (see LICENSE).
Contributions
I welcome feedback and contributions. I tried to write code using well-known OO design patterns: Builder (building a graph), Strategy (generating edges between nodes in a graph) and Visitor (codegen). Hopefully, this will help the reader understand the code structure.
Report bugs
Please submit issues here.