d3line
A simple line chart directive using d3js on Angular
![]()
Installation
Install using Bower:
bower install --save d3line
Install using npm:
npm install --save d3line
Using the d3line Directive
Include the d3LineModule dependency in your Angular module:
var app = angular.module('demoapp', ['d3LineModule']);
If installed through npm, add the following lines as well:
require('d3');
require('d3line');
Fetch or Add the chart data into your controller in the following format:
$scope.chartData = [
  {series: 'A',x: 1,y: 34},
  {series: 'A',x: 2,y: 66},
  {series: 'A',x: 3,y: 77},
  {series: 'A',x: 4,y: 70},
  {series: 'A',x: 5,y: 40},

  {series: 'B',x: 1,y: 74},
  {series: 'B',x: 2,y: 26},
  {series: 'B',x: 3,y: 67},
  {series: 'B',x: 4,y: 30},
  {series: 'B',x: 5,y: 90},

  {series: 'C',x: 1,y: 54},
  {series: 'C',x: 2,y: 76},
  {series: 'C',x: 3,y: 27},
  {series: 'C',x: 4,y: 80},
  {series: 'C',x: 5,y: 70}
];
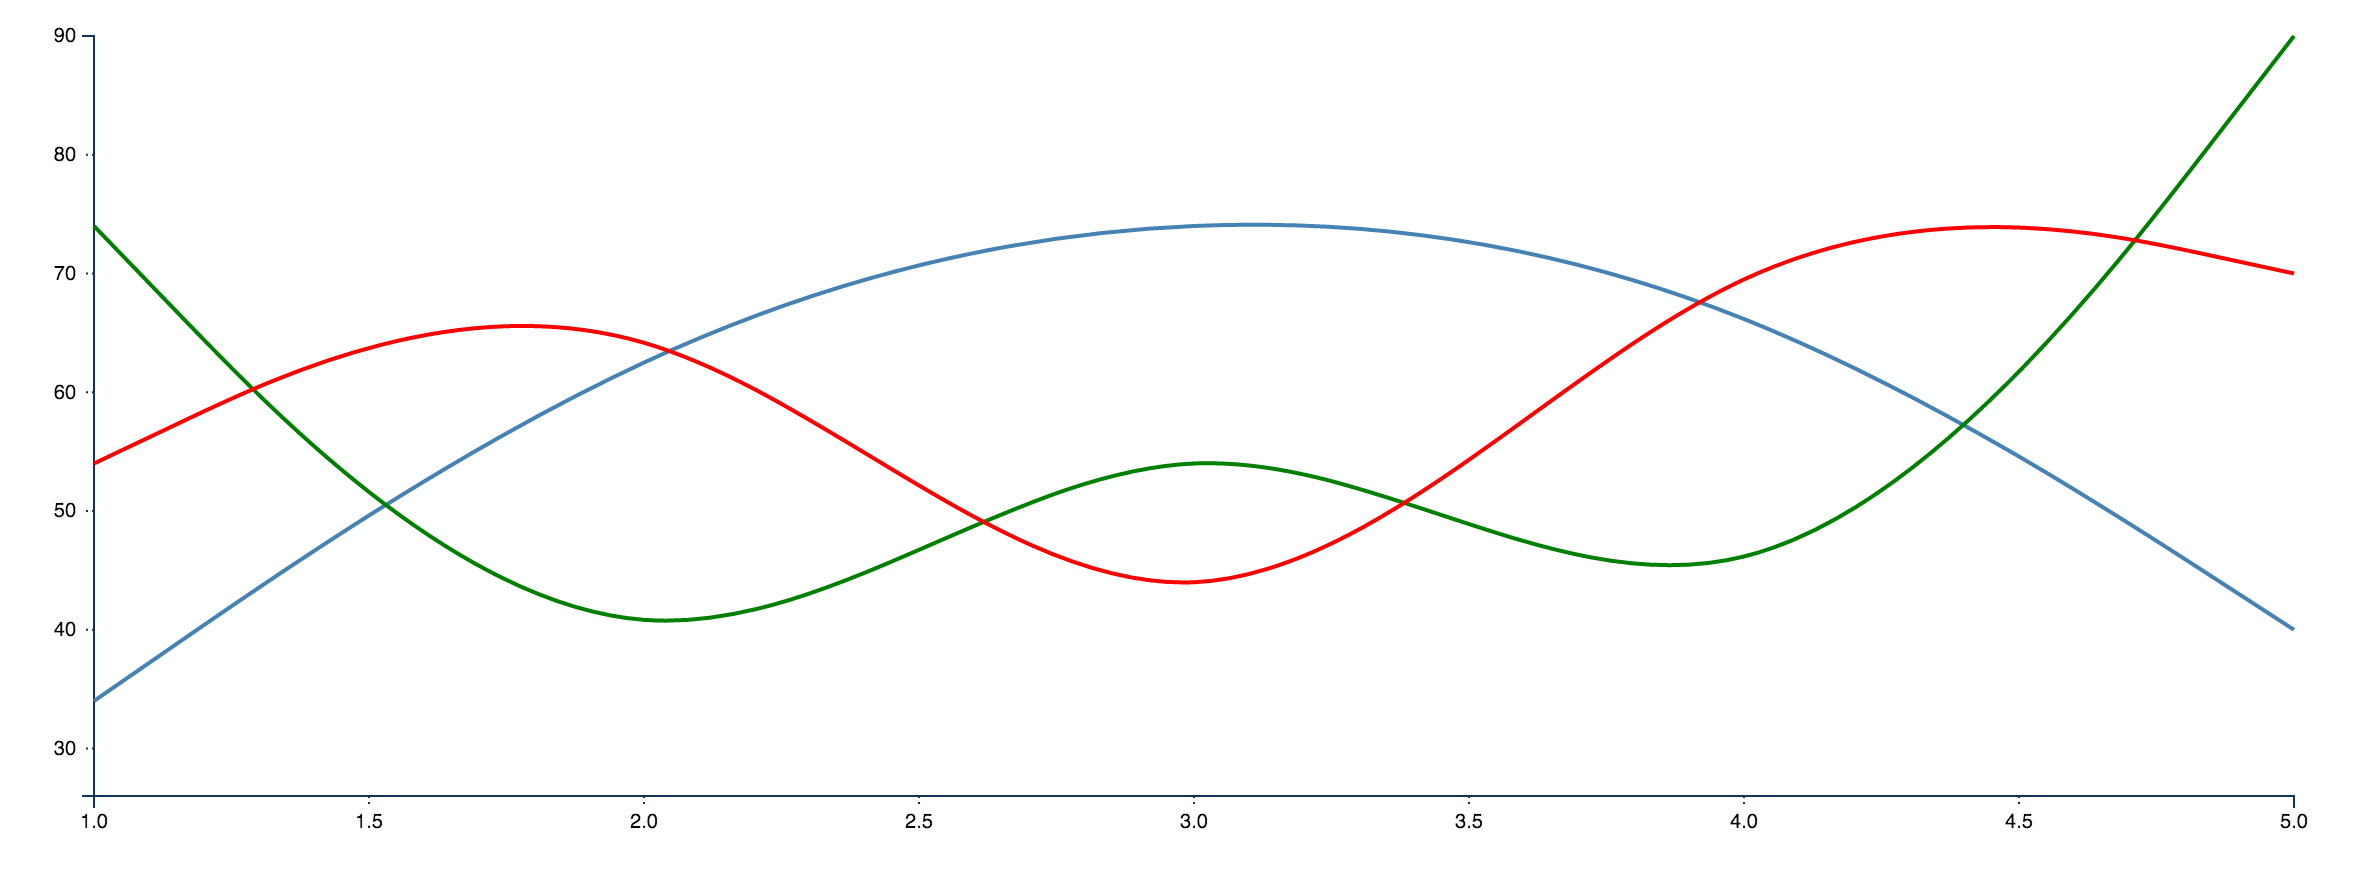
Now, to create the chart, use the following command:
<d3-line data="chartData" width="1200" height="400"></d3-line>
Here's how the chart looks:
Getting to know D3
D3.js is an amazing visualization library with a lot of powerful features. To learn more about D3, visit http://d3js.org
LICENSE
MIT