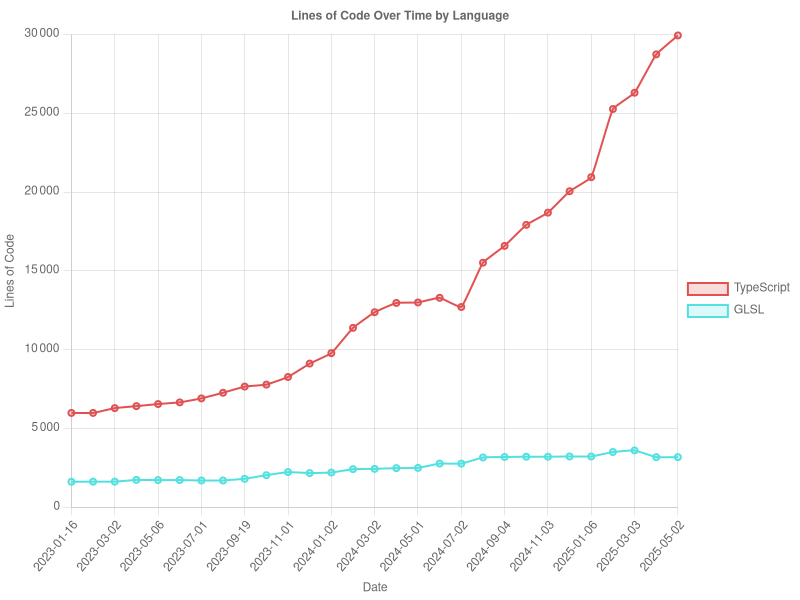
A TypeScript tool for tracking lines of code over time by language with visualization.
- Node.js
- Git
- cloc (Count Lines of Code) installed and available in your PATH
npm install -g cloc-graphnpm install cloc-graphcloc-graph [options]
-
-p, --path <path>: Path to the Git repository (default: current directory) -
-s, --step <number>: Sample every Nth commit (default: 1) -
-g, --granularity <type>: Granularity: commits | daily | weekly | monthly (default: commits) -
-t, --top <number>: Limit to top N languages by total lines (default: all languages) -
-e, --exclude <languages>: Comma-separated list of languages to exclude (e.g., "HTML,CSS") -
-i, --include <languages>: Comma-separated list of languages to include (e.g., "JavaScript,TypeScript") -
-f, --from <date>: Start date for time range in YYYY-MM-DD format -
-u, --to <date>: End date for time range in YYYY-MM-DD format -
-m, --max-samples <number>: Maximum number of commits to analyze (default: 100) -
--smart-sampling: Use smart sampling algorithm for large repositories
# Generate graph for current repository
cloc-graph

# Generate graph for a specific repo with weekly granularity
cloc-graph -p /path/to/repo -g weekly

# Generate graph showing only the top 5 languages
cloc-graph -t 5

# Sample every 10th commit to process large repositories faster
cloc-graph -s 10

# Generate graph excluding certain languages
cloc-graph -e HTML,CSS

# Generate graph including only specific languages
cloc-graph -i JavaScript,TypeScript

# Generate graph for a specific time range
cloc-graph -f 2023-01-01 -u 2023-12-31

# Process large repositories more efficiently
cloc-graph --smart-sampling -m 200The tool generates two files:
-
loc_over_time_by_lang.csv: CSV file containing the lines of code for each language at each point in time -
loc_chart.png: A line chart visualization showing the trends of lines of code over time by language
git clone https://github.com/yourusername/cloc-graph.git
cd cloc-graph
npm installnpm run buildnpm run dev# Run all tests
npm test
# Run tests in watch mode during development
npm run test:watch
# Generate test coverage report
npm run test:coverageThis project uses Prettier for code formatting. You can format your code with:
npm run formatsrc/
├── cli/ # Command-line interface handling
├── services/ # Core services
│ ├── chartService.ts # Chart generation
│ ├── clocService.ts # Code analysis
│ └── gitService.ts # Git repository interaction
├── types/ # TypeScript type definitions
├── utils/ # Utility functions
│ ├── dateUtils.ts # Date manipulation utilities
│ └── sampling.ts # Sampling algorithms
└── __tests__/ # Test files
Contributions are welcome! Please feel free to submit a Pull Request.
- Fork the repository
- Create your feature branch (
git checkout -b feature/amazing-feature) - Run tests to ensure everything works (
npm test) - Commit your changes (
git commit -m 'Add some amazing feature') - Push to the branch (
git push origin feature/amazing-feature) - Open a Pull Request
Please make sure your code passes all tests and follows the project's coding style.
MIT © Barthélemy Paléologue
See the LICENSE file for details.

