aws-cloudwatch-chart
A node.js module to draw charts for AWS CloudWatch metrics
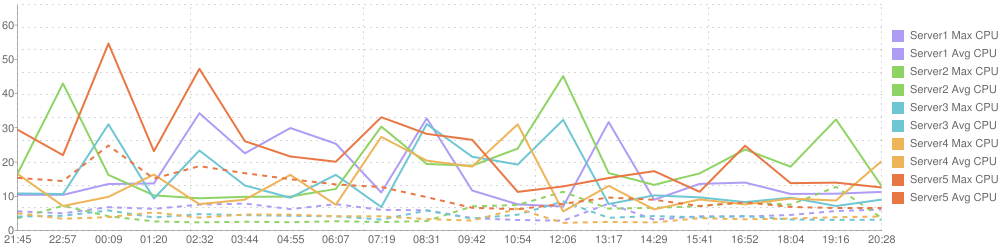
Example chart:
Installation:
npm install aws-cloudwatch-chartUsage:
var AwsCloudWatchChart = ; var config = ; var acs = config; acsor
acsconfig.json example:
"metrics": /// array of metrics settings /// Title of metrics. Will be displayed on chart's legend. Should be unique "title": "Server1 Max CPU" /// AWS namespace /// http://docs.aws.amazon.com/AmazonCloudWatch/latest/DeveloperGuide/aws-namespaces.html "namespace": "AWS/EC2" /// Metric name /// http://docs.aws.amazon.com/AmazonCloudWatch/latest/DeveloperGuide/CW_Support_For_AWS.html "metricName": "CPUUtilization" /// Statistics values. 'Maximum' and "Average" supported "statisticValues": "Maximum" /// Unit. http://docs.aws.amazon.com/AmazonCloudWatch/latest/APIReference/API_GetMetricStatistics.html /// 'Percent' and 'Count' currently supported "unit": "Percent" /// Chart line color for this metric "color": "af9cf4" /// Line thickness in px "thickness": 2 /// Dashed or solid "dashed": false /// Any property other that listed above will be added to Dimensions array. It's different for different metrics namespaces /// InstanceId. This parameter is for Dimensions array. Different for different metrics namespaces /// http://docs.aws.amazon.com/AmazonCloudWatch/latest/APIReference/API_Dimension.html "InstanceId": "i-2d55aad0" "aws": /// AWS IAM accessKeyId /// Dpn't forget to allow IAM to access CloudWatch. Not other policies are required. Safe. "accessKeyId": "XXXXXXXXXXXXXXXXXX" /// AWS IAM secretAccessKey "secretAccessKey": "XXXXXX/XXXXXXXXX/XXXXXXXXXXX/XXXXXXXXX" /// AWS region "region": "us-east-1" "timeOffset": 1440 //// Get statistic for last 1440 minutes "timePeriod": 60 //// Get statistic for each 60 seconds "chartSamples": 20 //// Data points extrapolated on chart "width": 1000 //// Result image width. Maximum value for width or height is 1,000. Width x height cannot exceed 300,000. "height":250 //// Result image height. Maximum value for width or height is 1,000. Width x height cannot exceed 300,000. AWS Lambda ready:
Sample AWS Lambda function. Posts CloudWatch Alerts via SNS topic via Lambda function to Slack channel. And draws charts for CPUUtilization and CPUCreditBalance (for T2 instances) metrics.
Source
License
MIT