
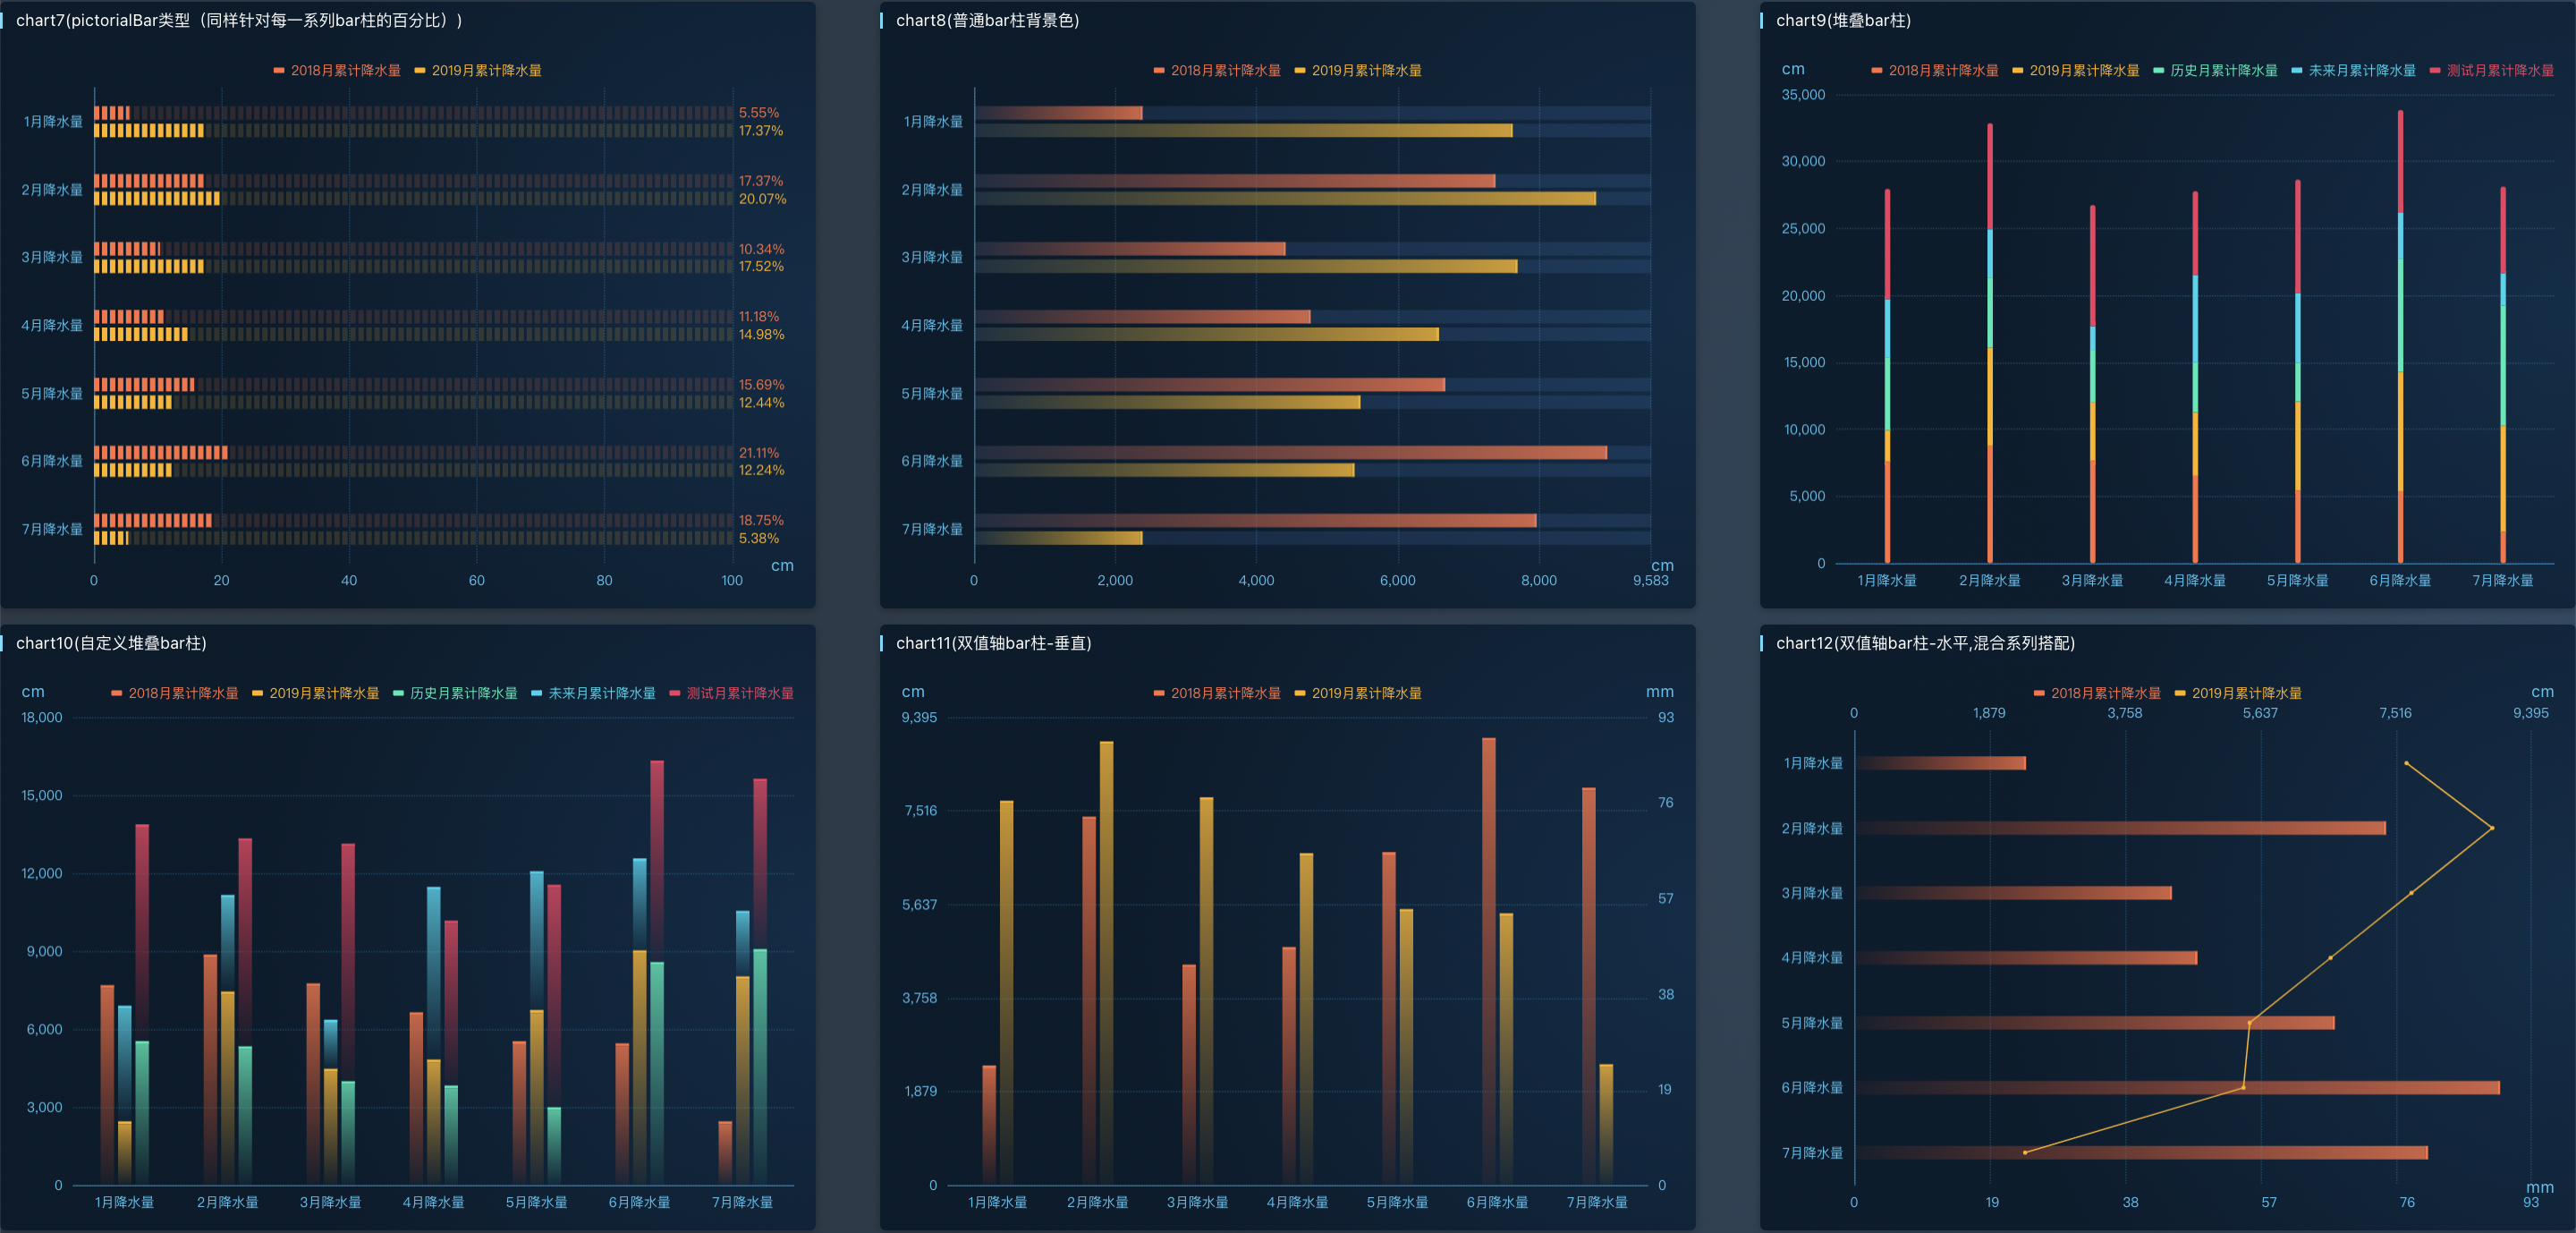
AxisChart
AxisChart组件是对于echarts、echarts-for-react组件的二次封装,
它的初衷是出于对于echarts图表库的图表展示数据显示出的内容边界以及距离尺寸设置不够"灵活",
导致对于不同场景的数据显示的图表产生的边框溢出显示问题,
AxisChart最重要的不是它的配置参数调控,而是它具有内部的自动化尺寸处理调控的功能,
足以应对各种数据层次的显示而使得图表的显示没有越出边界超出显示,
它附带的各种参数化配置不是组件创始的本意,只是应对各种项目经理的奇葩需求应运而生的畸形配置
Install
npm i awesome-axis-chartnpm start
Usage
import AxisChart, { chartData } from "awesome-axis-chart";

/** Demo1 */
function App1() {
  const chartDataTemp = cloneDeep(chartData)
  // 测试数据
  const monthAverageRainfallList: {
    // 月份
    month: string | number;
    // 系列数据类型
    type: "2018月累计降水量" | "2019月累计降水量" | "历史月累计降水量" | "未来月累计降水量" | "测试月累计降水量";
    // 数据值
    value: number;
  }[] = [
    /** 2018月累计降水量 */
    {month: 1, type: "2018月累计降水量", value: 7586},
    {month: 2, type: "2018月累计降水量", value: 8765},
    {month: 3, type: "2018月累计降水量", value: 7654},
    {month: 4, type: "2018月累计降水量", value: 6543},
    {month: 5, type: "2018月累计降水量", value: 5432},
    {month: 6, type: "2018月累计降水量", value: 5348},
    {month: 7, type: "2018月累计降水量", value: 2348},
    /** 2019月累计降水量 */
    {month: 1, type: "2019月累计降水量", value: 2348},
    {month: 2, type: "2019月累计降水量", value: 7343},
    {month: 3, type: "2019月累计降水量", value: 4372},
    {month: 4, type: "2019月累计降水量", value: 4726},
    {month: 5, type: "2019月累计降水量", value: 6632},
    {month: 6, type: "2019月累计降水量", value: 8925},
    {month: 7, type: "2019月累计降水量", value: 7925},
    /** 历史月累计降水量 */
    {month: 1, type: "历史月累计降水量", value: 5437},
    {month: 2, type: "历史月累计降水量", value: 5235},
    {month: 3, type: "历史月累计降水量", value: 3893},
    {month: 4, type: "历史月累计降水量", value: 3727},
    {month: 5, type: "历史月累计降水量", value: 2891},
    {month: 6, type: "历史月累计降水量", value: 8476},
    {month: 7, type: "历史月累计降水量", value: 8976},
    /** 未来月累计降水量 */
    {month: 1, type: "未来月累计降水量", value: 4346},
    {month: 2, type: "未来月累计降水量", value: 3612},
    {month: 3, type: "未来月累计降水量", value: 1784},
    {month: 4, type: "未来月累计降水量", value: 6538},
    {month: 5, type: "未来月累计降水量", value: 5233},
    {month: 6, type: "未来月累计降水量", value: 3437},
    {month: 7, type: "未来月累计降水量", value: 2417},
    /** 测试月累计降水量 */
    {month: 1, type: "测试月累计降水量", value: 8234},
    {month: 2, type: "测试月累计降水量", value: 7895},
    {month: 3, type: "测试月累计降水量", value: 9035},
    {month: 4, type: "测试月累计降水量", value: 6239},
    {month: 5, type: "测试月累计降水量", value: 8454},
    {month: 6, type: "测试月累计降水量", value: 7648},
    {month: 7, type: "测试月累计降水量", value: 6448},
  ];

  Object.assign(chartDataTemp, {
    data: monthAverageRainfallList.map((item, index) => {
      return [`${index}`, `${item.type}`, `${item.month}月降水量`, item.value];
    }),
  })
  // 最简单的使用
  return (
    <AxisChart
      // 默认垂直暗黑系风格
      theme="verticalDark"
      chartData={chartDataTemp}
      // 关于配置由于太多了这里不展示,具体可参考代码内部test文件夹下的demo或者组件内部文档注释
      // basicConfigOption={{ ??? }}
      subColor={[
        "#ff7043", "#ffb300", "#1de9b6", "#00d4ec",
        "#ed3e61", "#bccd07", "#04ce1c", '#058ff8',
      ]}
    />
  );
}

/** Demo2 */
function App2() {
  const chartDataTemp = cloneDeep(chartData)
  // 测试数据
  const monthAverageRainfallList: {
    // 月份
    month: string | number;
    // 18年月平均降雨量
    eighteenRainfall: number;
    // 19年月平均降雨量
    nineteenRainfall: number;
    // 历史月平均降雨量
    historyRainfall: number;
    // 未来月平均降雨量
    futureRainfall: number;
    // 测试月平均降雨量
    testRainfall: number;
  }[] = [
    {month: 1, eighteenRainfall: 7586, nineteenRainfall: 2348, historyRainfall: 5437, futureRainfall: 4346, testRainfall: 8234},
    {month: 2, eighteenRainfall: 8765, nineteenRainfall: 7343, historyRainfall: 5235, futureRainfall: 3612, testRainfall: 7895},
    {month: 3, eighteenRainfall: 7654, nineteenRainfall: 4372, historyRainfall: 3893, futureRainfall: 1784, testRainfall: 9035},
    {month: 4, eighteenRainfall: 6543, nineteenRainfall: 4726, historyRainfall: 3727, futureRainfall: 6538, testRainfall: 6239},
    {month: 5, eighteenRainfall: 5432, nineteenRainfall: 6632, historyRainfall: 2891, futureRainfall: 5233, testRainfall: 8454},
    {month: 6, eighteenRainfall: 5348, nineteenRainfall: 8925, historyRainfall: 8476, futureRainfall: 3437, testRainfall: 7648},
    {month: 7, eighteenRainfall: 2348, nineteenRainfall: 7925, historyRainfall: 8976, futureRainfall: 2417, testRainfall: 6448},
  ];

  Object.assign(chartDataTemp, {
    data: monthAverageRainfallList.reduce((preItem, item, index) => {
      // 注意:后续组件内会使用getNumbersByStrings方法进行数据提取,但是它必须要求数组第一个元素是字符串
      // 且getRangeByIndex方法提取类目数据时也需要是字符串,所以数组第三个元素必须是字符串
      // index索引5,6为添加的辅助数据(tooltip显示用,不参与图表渲染)
      const itemData: [string, string, string, number, number, number][] = [
        [`${index}`, "2018月累计降水量", `${item.month}月降水量`, item.eighteenRainfall],
        [`${index + 1}`, "2019月累计降水量", `${item.month}月降水量`, item.nineteenRainfall],
        [`${index + 2}`, "历史月累计降水量", `${item.month}月降水量`, item.historyRainfall],
        [`${index + 3}`, "未来月累计降水量", `${item.month}月降水量`, item.futureRainfall],
        [`${index + 4}`, "测试月累计降水量", `${item.month}月降水量`, item.testRainfall],
      ]
      return [...preItem, ...itemData]
    }, ([] as [string, string, string, number, number, number][])),
  })
  // 最简单的使用
  return (
    <AxisChart
      // 默认垂直暗黑系风格
      theme="verticalDark"
      chartData={chartDataTemp}
      // 关于配置由于太多了这里不展示,具体可参考代码内部test文件夹下的demo或者组件内部文档注释
      // basicConfigOption={{ ??? }}
      subColor={[
        "#ff7043", "#ffb300", "#1de9b6", "#00d4ec",
        "#ed3e61", "#bccd07", "#04ce1c", '#058ff8',
      ]}
    />
  );
}
Effective Demo View


License
MIT License (c) 刘善保