
Angular Sunburst Radar Chart
A Sunburst chart component in Angular developed using no dependencies, offCourse used SVG
Updates
Migrated options into seperate object
Able to rotate the chart by dragging
smoother animations
Better tool tip
To Use
Import AngularSunburstRadarChartModule to your module .
 imports: [
    ... Other modules
    AngularSunburstRadarChartModule
  ],
in your component.ts
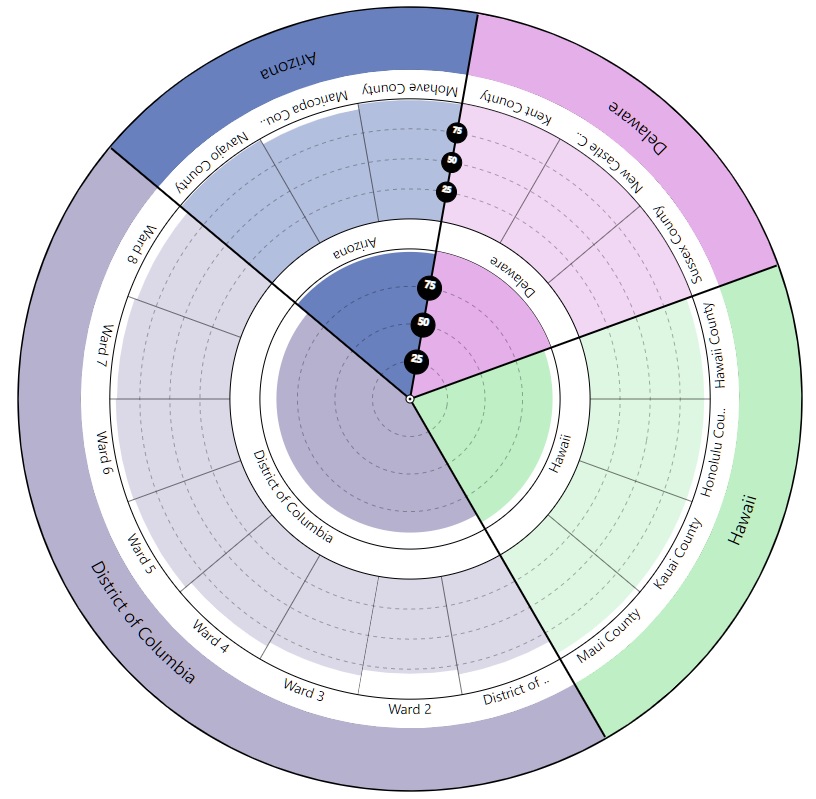
  const options = {"size":800,"maxScore":100,"legendAxisLinePosition":1,"animateChart":false,"splitBasedOnChildren":true}

  const items = [  {   "name": "Delaware ",   "color": "#e5b0e9",   "value": 100,   "children": [    {     "name": "Kent County",     "value": 100    },    {     "name": "New Castle County",     "value": 100    },    {     "name": "Sussex County",     "value": 100    }   ]  },
                 {   "name": "Hawaii ",   "value": 95,   "color": "#beefc5",   "children": [    {     "name": "Hawaii County",     "value": 95    },    {     "name": "Honolulu County",     "value": 95    },    {     "name": "Kauai County",     "value": 95    },    {     "name": "Maui County",     "value": 95    }   ]  },
                {   "name": "District of Columbia ",   "color": "#b7b1d0",   "value": 89,   "children": [    {     "name": "District of Columbia",     "value": 83    },    {     "name": "Ward 2",     "value": 79    },    {     "name": "Ward 3",     "value": 84    },    {     "name": "Ward 4",     "value": 88    },    {     "name": "Ward 5",     "value": 94    },    {     "name": "Ward 6",     "value": 95    },    {     "name": "Ward 7",     "value": 94    },    {     "name": "Ward 8",     "value": 92    }   ]  },
                 {   "name": "Arizona ",   "value": 98,   "color": "#6880be",   "children": [    {     "name": "Navajo County",     "value": 99    },    {     "name": "Maricopa County",     "value": 95    },    {     "name": "Mohave County",     "value": 99    }   ]  } ]
in your component.html
<lib-sunburst-radar-chart [options]="options" [items]="items"></lib-sunburst-radar-chart>
The above will display chart something like below
| Parameter | Data Type | Description |
|---|---|---|
| items | Item[] | List of items to be displayed on chart in Array format of type Item |
| options | Options | Options to be used in chart |
Options Data Type
| Parameter | Data Type | Default | Description |
|---|---|---|---|
| size | number | 800 | Size of Chart |
| maxScore | number | 100 | Maximum score of the values |
| legendAxisLinePosition | number | 1 | The position where the legend axis labels to be displayed |
| animateChart | boolean | true | Animate the chart while showing |
| splitBasedOnChildren | boolean | true | To split the angles equally based on the total children nodes available |
Item Data Type
| Parameter | Data Type | Description |
|---|---|---|
| name | string | name of the item |
| value | number | value of Item |
| color | string | HexCode color string #FFF000 |
| children | Array of Item | Array of the same item data type |
If you find it useful, try considering
![]()