
The Javascript & TypeScript map SDK tailored for MapTiler Cloud
![]()
![]()


The MapTiler SDK JS extends MapLibre GL JS, exposes all its features, and adds new ones on top. The SDK is designed to work with the well-established MapTiler Cloud service, which provides all the data required to fuel a complete web mapping experience: vector tiles, satellite raster tiles, DEM with Terrain RGB, custom styles with an editor, etc.
Why are we creating a new SDK? To make things simpler for developers working in the MapTiler ecosystem! With MapTiler SDK JS, there is no need to load external plugins for the most basic things, copy-paste complex data source URLs, or look up the syntax to enable 3D terrain every time you start a project. All this is built-in, loaded when needed, or exposed with simple functions. Under the hood, this SDK is opinionated as it's being fed by MapTiler Cloud data, but its MapLibre core makes it 100% compatible with other sources.
In addition, the MapTiler SDK JS provides well-documented and easy-to-use wrapper functions to the MapTiler Cloud API services such as: geocoding, static maps, geolocation, as well as a search engine for coordinate reference systems and transforming coordinates from one CRS to another.
📣 Note: If you need only the API Client library to use in a headless fashion and without any map display, check out MapTiler Client JS library for browser and NodeJS.

npm install --save @maptiler/sdkIn addition to the details and examples provided in this readme, check out the complete API documentation
Recommended for: advanced applications
import { config, Map } from '@maptiler/sdk';

// Add your MapTiler Cloud API key to the config
// (Go to https://cloud.maptiler.com/account/keys/ to get one for free!)
config.apiKey = 'YOUR_API_KEY';

// Let's say you have a DIV ready to receive a map
const mapContainer = document.getElementById('my-container-div');

// Instantiate the map
const map = new Map({
  container: mapContainer,
});
Alternatively, the apiKey can be set as Map option instead of in the config object. Yet, this will still internally propagate to the config object:
import { Map } from '@maptiler/sdk';

// Let's say you have a DIV ready to receive a map
const mapContainer = document.getElementById('my-container-div');

// Instantiate the map
const map = new Map({
  container: mapContainer,
  apiKey: 'YOUR_API_KEY'
});
By default, the map will be initialized with the style streets-v2.
Depending on the framework and environment you are using for your application, you will have to also include the CSS file.
For example, with a NextJS app, this can take place at the top of the file _app.ts/js:
import "@maptiler/sdk/dist/maptiler-sdk.css";The SDK is fully typed, but it may happen that types defined in Maplibre GL JS are not visible in your project. This is a known issue that comes from Maplibre being a CommonJS bundle.
There are mainly two ways to address this issue and access to the complete type definition.
- With
esModuleInterop
Set the following in your tsconfig.json:
{
  "compilerOptions": {
    // ...
    "esModuleInterop": true,
  }
}- With
moduleResolution
Set the following in your tsconfig.json:
{
  "compilerOptions": {
    // ...
    "moduleResolution": "Bundler",
  }
}
Note that this second option is not always possible as some frameworks and other dependencies won't let you use the "Bundler" mode.
The SDK hosted on our CDN is bundled as Universal Module Definition (UMD) to make it standalone and contain all its dependencies. The CDN also serves the style sheet (CSS).
Recommended for: simple map integration example and demos
<html>
  <head>
    <title>MapTiler JS SDK example</title>
    <style>
      html, body {
        margin: 0;
      }

      #map-container {
        position: absolute;
        width: 100vw;
        height: 100vh;
      }
    </style>

    <!-- Load the SDK CSS -->
    <link rel="stylesheet" href="dist/maptiler-sdk.css">
  </head>

  <body>
    <div id="map-container"></div>

    <script src ="dist/maptiler-sdk.umd.min.js"></script>

    <script>
      // Add your MapTiler Cloud API key to the config
      // (Go to https://cloud.maptiler.com/account/keys/ to get one for free!)
      maptilersdk.config.apiKey = 'YOUR_API_KEY';

      const mapContainer = document.getElementById('my-container-div');

      const map = new maptilersdk.Map({
        container: mapContainer,
        style: maptilersdk.MapStyle.STREETS_DARK,
        hash: true,
      })
    </script>
  </body>
</html>
Check out the minimalist code samples in the demos directory.
MapTiler teams maintain a few styles that we have decided to expose from the SDK. This has two advantages:
- they are easier to remember, no need to type along style URL
- if we make an update to a style, you will benefit from it without modifying your codebase
Here is how it works:
import { Map, MapStyle } from '@maptiler/sdk'

// When instanciating a map
const map = new Map({
  container: document.getElementById("my-container-div"),
  style: MapStyle.OUTDOOR, // <-- the shorthand for the outdoor style
});

// Or later on, updating the style
map.setStyle(MapStyle.STREETS.DARK);
The styles with a shorthand provided by the SDK are the following:
| ID | Screenshot | Comment |
|---|---|---|
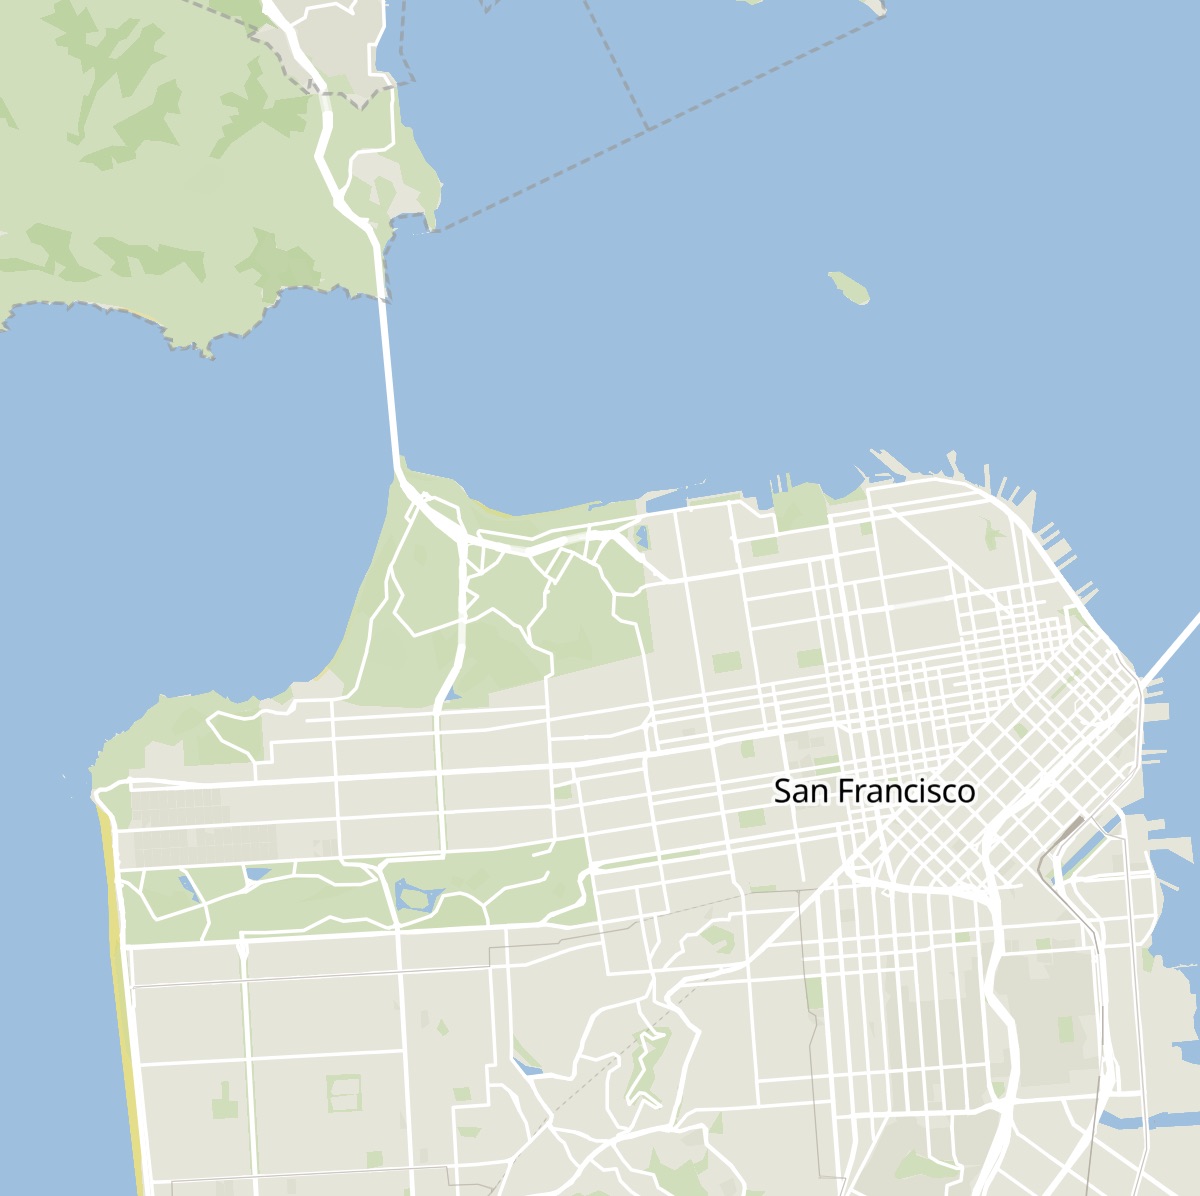
MapStyle.STREETS |
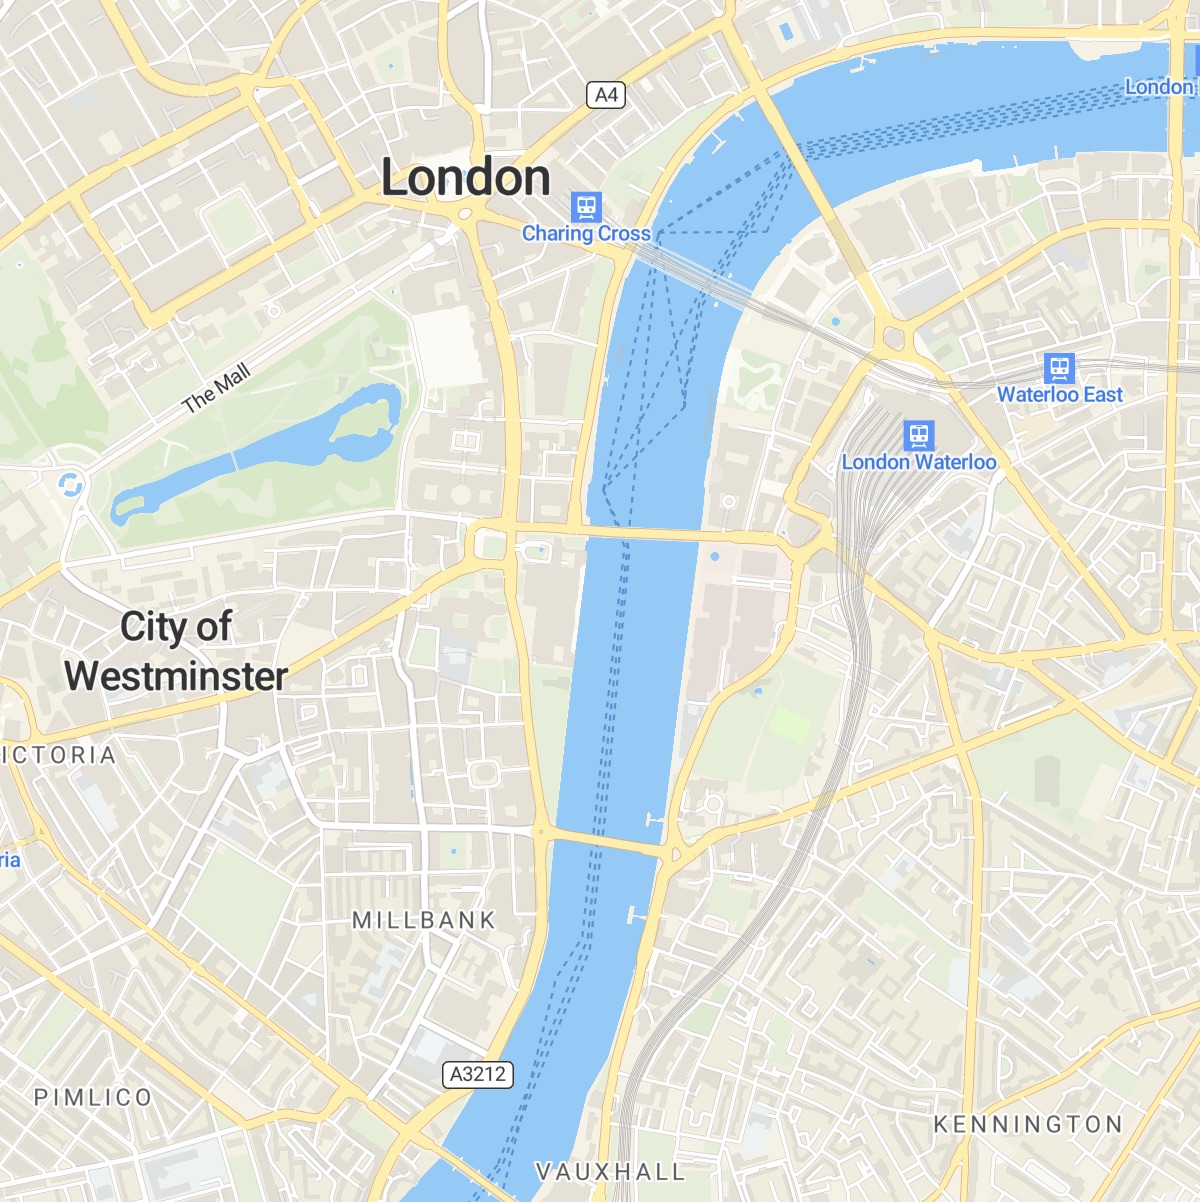 |
The classic default style, perfect for urban areas. Also available in dark and light mode. |
MapStyle.DATAVIZ.DARK |
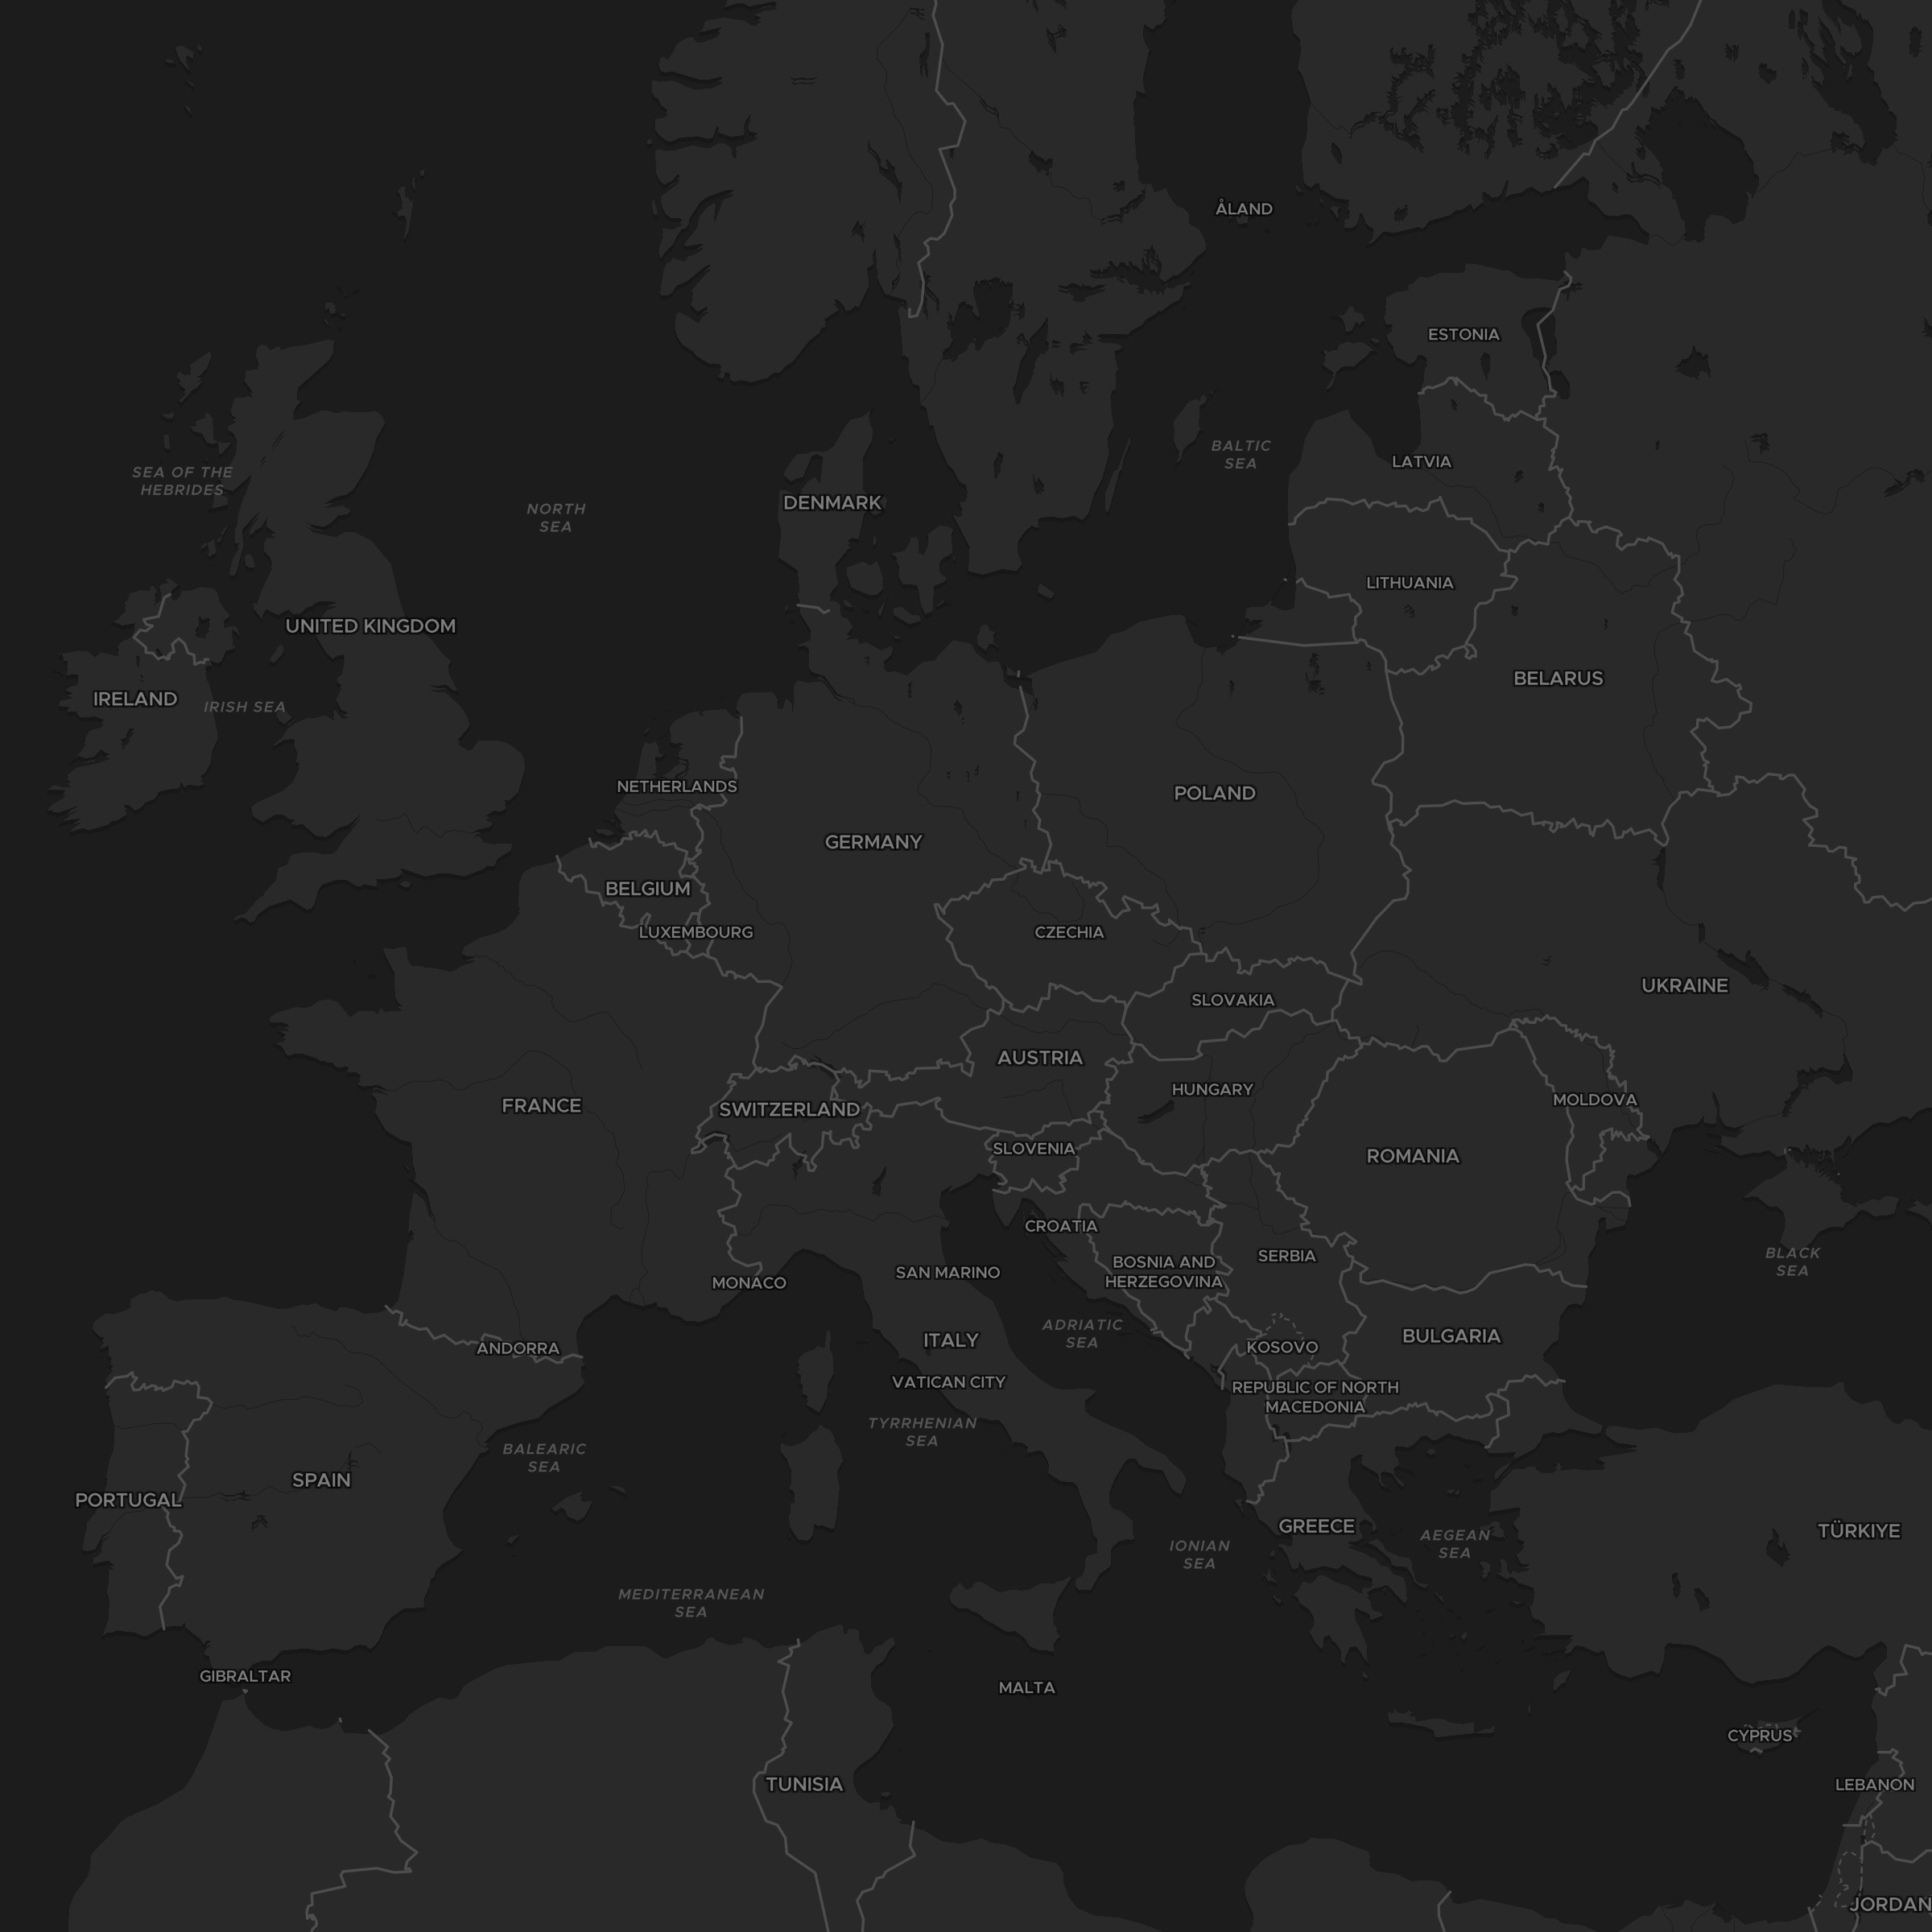 |
A minimalist style for data visualization. Also available in color and light mode |
MapStyle.SATELLITE |
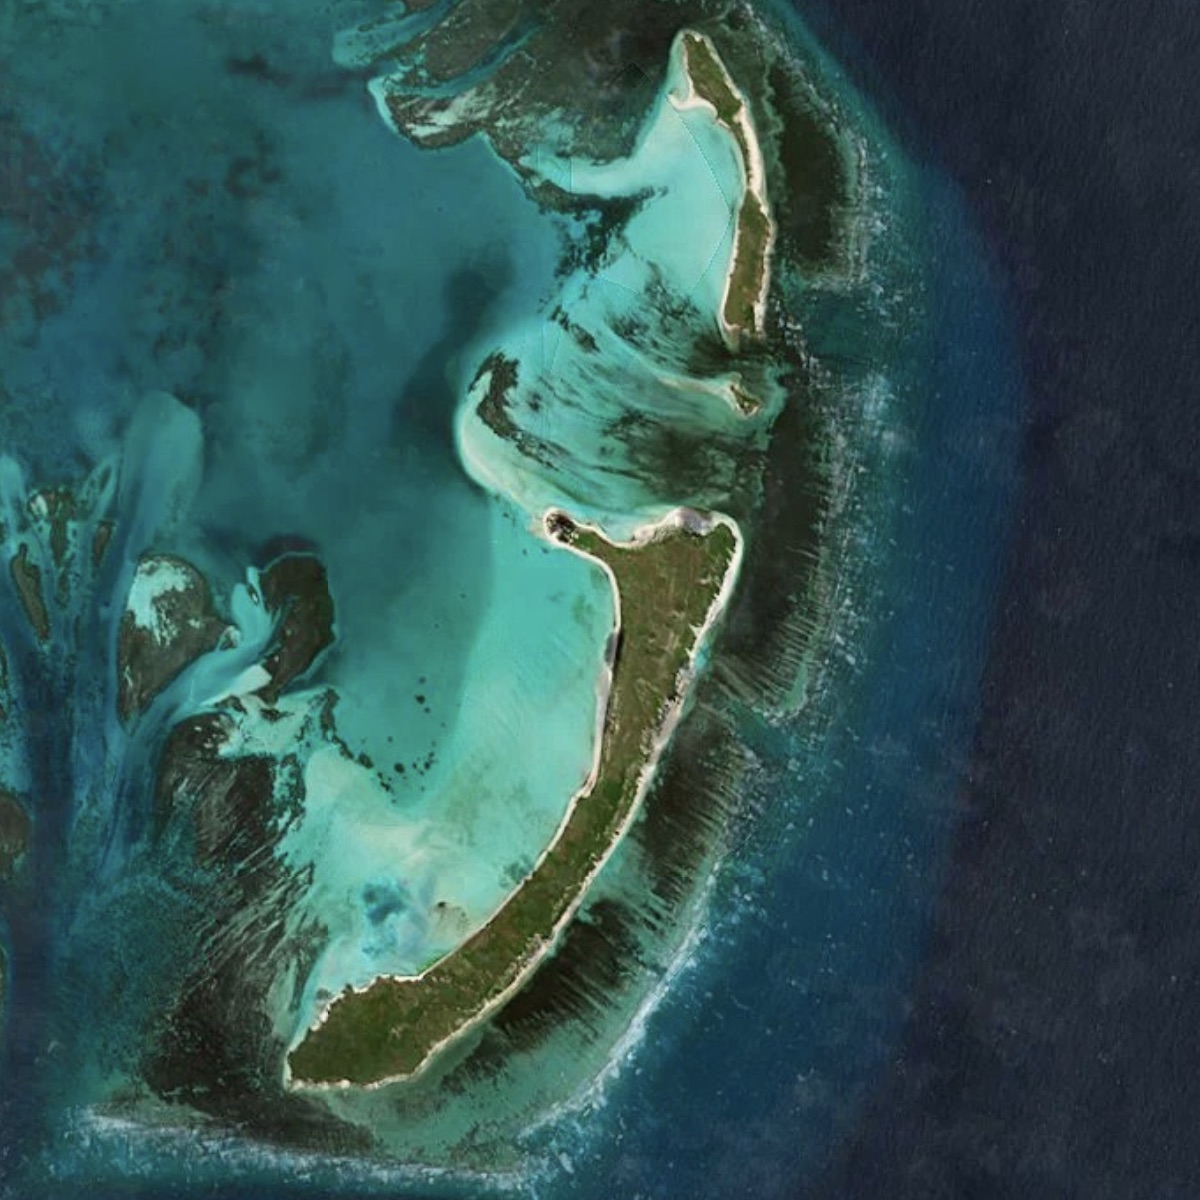 |
Only high resolution satellite raster tiles without any labels |
MapStyle.HYBRID |
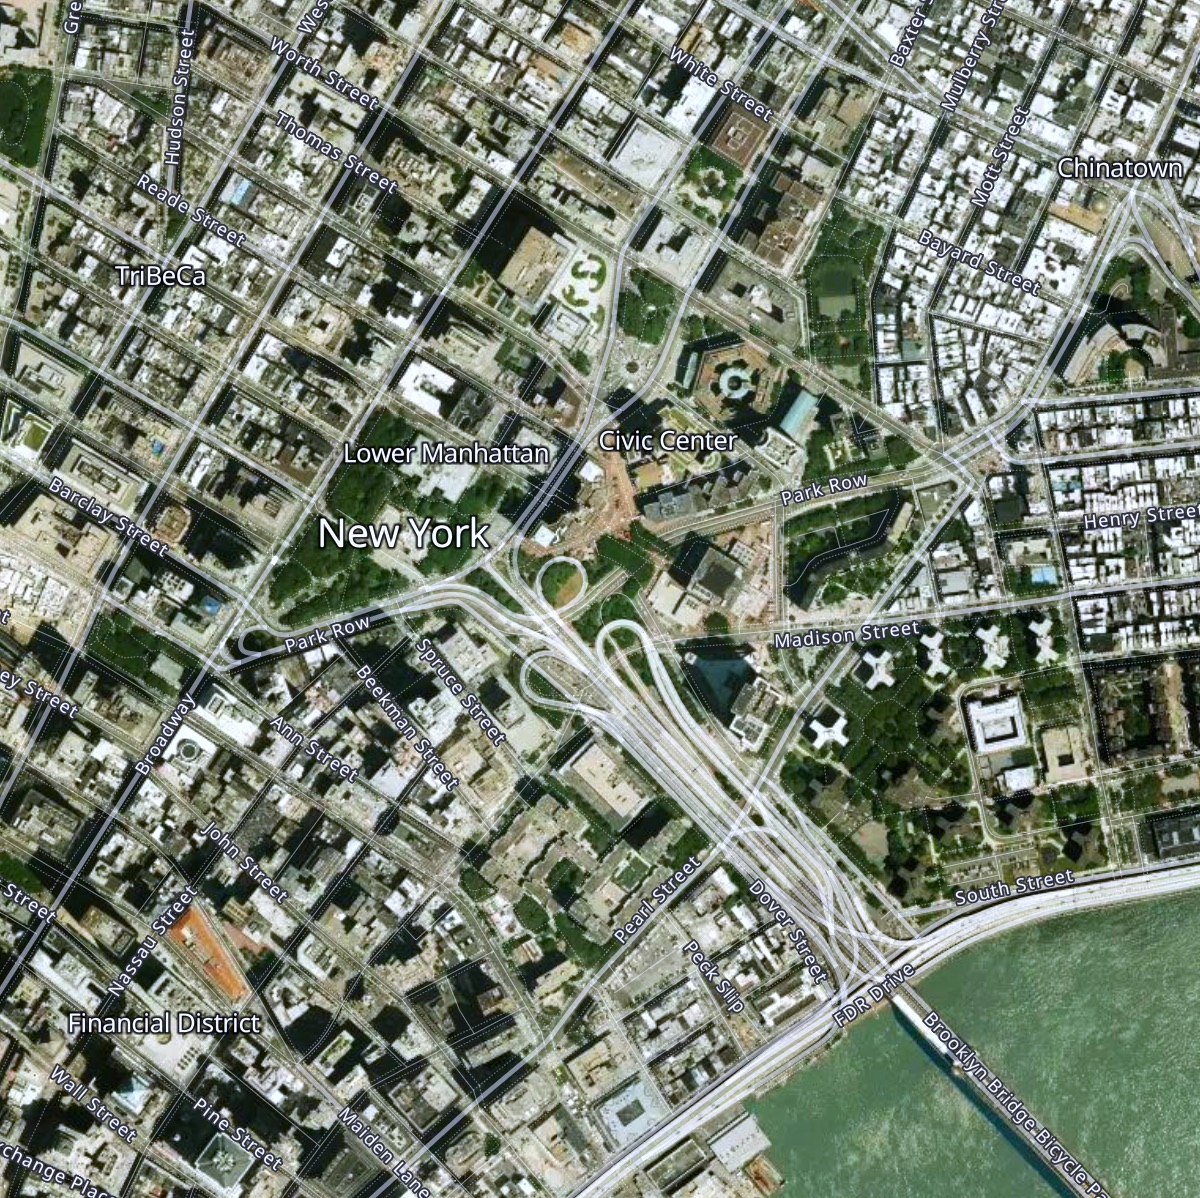 |
Satellite tile with labels, landmarks, roads ways and political borders |
MapStyle.OUTDOOR |
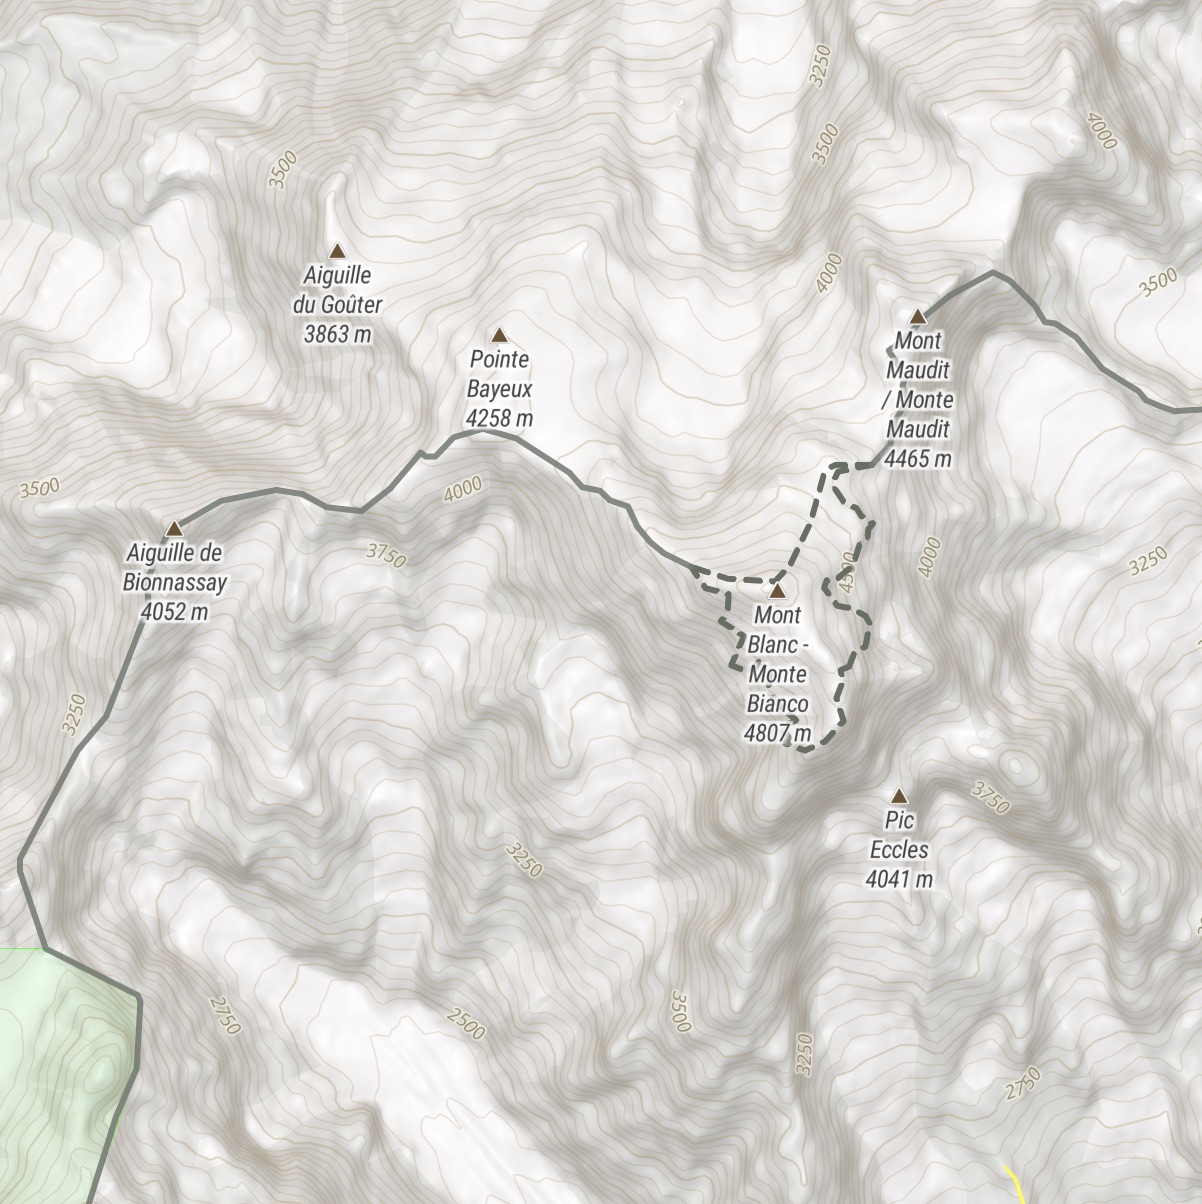 |
A solid hiking companion, with peaks, parks, isolines and more |
MapStyle.BASIC |
 |
A minimalist alternative to STREETS, with a touch of flat design.Also available in dark and light and pastel mode. |
Know more about built-in map styles
MapTiler provides some reference styles as well as some variants for each. A reference style sets some guidelines about what kind of information is displayed, the granularity of the information, and more generally defines a purpose for which this style is the most relevant: street navigation, outdoor adventure, minimalist dashboard, etc. Then, each reference style offers a range of variants that contain the same level of information and have the same purpose but use different color schemes.
Here is the full list:
-
MapStyle.STREETS, reference style for navigation and city exploration-
MapStyle.STREETS.DARK(variant) -
MapStyle.STREETS.LIGHT(variant) -
MapStyle.STREETS.PASTEL(variant)
-
-
MapStyle.SATELLITEreference style satellite and airborne imagery (no variants) -
MapStyle.HYBRIDreference style satellite and airborne imagery with labels (no variants) -
MapStyle.OUTDOORreference style for adventure -
MapStyle.WINTERreference style for winter adventure -
MapStyle.DATAVIZ, the perfect style for data visualization, with very little noise-
MapStyle.DATAVIZ.DARK(variant) -
MapStyle.DATAVIZ.LIGHT(variant)
-
-
MapStyle.BACKDROP, great style for data visualization when hillshading matters!-
MapStyle.BACKDROP.DARK(variant) -
MapStyle.BACKDROP.LIGHT(variant)
-
-
MapStyle.BASICreference style for minimalist design and general purpose-
MapStyle.BASIC.DARK(variant) -
MapStyle.BASIC.LIGHT(variant)
-
-
MapStyle.BRIGHTreference style for high-contrast navigation-
MapStyle.BRIGHT.DARK(variant) -
MapStyle.BRIGHT.LIGHT(variant) -
MapStyle.BRIGHT.PASTEL(variant)
-
-
MapStyle.TOPOreference style for topographic study-
MapStyle.TOPO.SHINY(variant) -
MapStyle.TOPO.PASTEL(variant) -
MapStyle.TOPO.TOPOGRAPHIQUE(variant)
-
-
MapStyle.VOYAGERreference style for stylish yet minimalist maps-
MapStyle.VOYAGER.DARK(variant) -
MapStyle.VOYAGER.LIGHT(variant) -
MapStyle.VOYAGER.VINTAGE(variant)
-
-
MapStyle.TONERreference style for very high contrast stylish maps-
MapStyle.TONER.BACKGROUND(variant) -
MapStyle.TONER.LITE(variant) -
MapStyle.TONER.LINES(variant)
-
-
MapStyle.OCEANreference style with bathymetric highlights, does not have any variants. -
MapStyle.LANDSCAPEreference style terrain map for data overlays and visualisations-
MapStyle.LANDSCAPE.DARK(variant) -
MapStyle.LANDSCAPE.VIVID(variant)
-
-
MapStyle.AQUARELLEreference style watercolor map for creative use-
MapStyle.AQUARELLE.DARK(variant) -
MapStyle.AQUARELLE.VIVID(variant)
-
-
MapStyle.OPENSTREETMAP(reference style, this one does not have any variants)
All reference styles (instances of ReferenceMapStyle) and style variants (instances of MapStyleVariant) have methods to know the alternative styles and variants that belong to the same reference style (.getVariants()). This is handy to provide a default/dark/light alternative color scheme, yet preserving the same level of details as in the reference style. Read more about about ReferenceMapStyle and MapStyleVariant.
You can also use classic styles with just a string if you know their MapTiler Cloud ID:
map.setStyle('outdoor-v2');And finally, you can use your own custom styles designed with our style editor. Every custom style is given a unique ID, for instance: c912ffc8-2360-487a-973b-59d037fb15b8.
This ID can be provided as such:
map.setStyle("c912ffc8-2360-487a-973b-59d037fb15b8");Or in its extended form:
map.setStyle("https://api.maptiler.com/maps/c912ffc8-2360-487a-973b-59d037fb15b8/style.json");
// this could be suffixed with the API token as well
And can even be provided in the URI form:
map.setStyle("maptiler://c912ffc8-2360-487a-973b-59d037fb15b8");The Web Mercator projection (Wikipedia) has been the go-to standard in cartography since the early days or web mapping. Partly for technical reasons but also because it is great for navigation as well as for showing the entire world in one screen, with no hidden face. That being said, Mercator's heavy distorsion at high latitudes, as well a the discontinuity at the poles can be a limitation for data visualization and has been critisized for providing a biased view of the world.
The globe projection, available starting from MapTiler SDK v3, does not suffer from these biases and can feel overall more playfull than Mercator. It can be a great choice for semi-global data visualization, especially for data close to the poles, thanks to its geographic continuity.
| Mercator projection | Globe projection |
|---|---|
 |
 |
The choice between Mercator and Globe can be done at different levels and moments in the lifecycle of the map, yet, unless stated otherwise, Mercator remains the default.
- In the style, using the
projectiontop-level property. For globe:
{
  "version": ...,
  "id": ...,
  "name": ...,
  "sources": ...,
  "layers": ...,

  // Make the style use the globe projection at load time
  "projection": {
    "type": "globe"
  }

  // ...
}
or for Mercator:
{
  "version": ...,
  "id": ...,
  "name": ...,
  "sources": ...,
  "layers": ...,

  // Make the style use the mercator projection at load time
  "projection": {
    "type": "mercator"
  }

  // ...
}- In the constructor of the
Mapclass, using theprojectionoption. For globe:
const map = new maptilersdk.Map({
  container: "map",
  projection: "globe", // Force a globe projection
});
or for Mercator:
const map = new maptilersdk.Map({
  container: "map",
  projection: "mercator", // Force a mercator projection
})
This will overwrite the projection property from the style (if any) and will persist it later if the map style was to change.
- Use the built-in methods:
map.enableGlobeProjection();
// or
map.enableMercatorProjection();
The projection setter built in Maplibre GL JS is also usable:
map.setProjection({type: "mercator"});
// or
map.setProjection({type: "globe"});- Using the
MaptilerProjectionControl. Not mounted by default, it can easily be added with a single option in theMapconstructor:
const map = new maptilersdk.Map({
  container: "map",
  projectionControl: true,  // or the position such as "top-left", "top-right",
});                         // "bottom-right" or "bottom-left"
This dedicated control will show a globe icon ![]() to transition from Mercator to globe projection and will show a flat map icon
to transition from Mercator to globe projection and will show a flat map icon ![]() to transition from globe to Mercator projection. The chosen projection persist with future style changes.
to transition from globe to Mercator projection. The chosen projection persist with future style changes.
The internal camera has a default vertical field of view (wikipedia) of a wide ~36.86 degrees. In globe mode, such a large FOV reduces the amount of the Earth that can be seen at once and exaggerates the central part, comparably to a fisheye lens. In many cases, a narrower FOV is preferable. Here is how to update if:
// Ajust de FOV, with values from 1 to 50
map.setVerticalFieldOfView(10);
📣 Note: with the Mercator projection, it is possible to set a FOV of
0, which yields a true orthographic projection (wikipedia), but the globe projection does not allow this.
Here is a table of FOV comparison:
| 01° | 10° | 20° | 30° | 40° | 50° |
|---|---|---|---|---|---|
 |
 |
 |
 |
 |
 |


📣 Note: Terrain is not fully compatible with the globe projection yet so it's better to disable it at low zoom level (from afar) and to choose the Mercator projection at higher zoom level (from up close).
It is sometimes handy to center the map on the visitor's location, and there are multiple ways of doing it but for the SDK, we have decided to make this extra simple by using the IP geolocation API provided by MapTiler Cloud, directly exposed as a single option of the Map constructor. There are two strategies:
-
POINT: centering the map on the actual visitor location, optionally using thezoomoption (zoom level13if none is provided). As a more precise option, if the user has previously granted access to the browser location (more precise) then this is going to be used. -
COUNTRY: fitting the map view on the bounding box of the visitor's country. In this case, thezoomoption, if provided, will be ignored
Here is how the map gets centered on the visitor's location:
new maptilersdk.Map({
  // ... other options

  geolocate: maptilersdk.GeolocationType.POINT
})
Here is how the map fits the visitor's country bounds:
new maptilersdk.Map({
  // ... other options

  geolocate: maptilersdk.GeolocationType.COUNTRY
})
The geolocation options will not be taken into consideration in the following cases:
- if the
centeroption is provided, then it prevails - if the
hashoption is provided with the valuetrueAND a location hash is already part of the URL. Ifhashistruebut there is not yet a location hash in the URL, then the geolocation will work.
📣 Note: if none of the options
centerorhashis provided to theMapconstructor, then the map will be centered using thePOINTstrategy, unless thegeolocatehas the valuefalse.
📣 Note 2: the term IP geolocation refers to finding the physical location of a computer using its IP address. The IP address is a numerical identifier of a computer within a network, just like the phone number for a telephone. The IP geolocation is not using the GPS of a device and usually provides a precision in the order of a few hundred meters. This precision may vary based on many local parameters such as the density of the network grid or the terrain, this is why it is generally better not to use a zoom level higher than
14.
The term "control" is commonly used for all sorts of buttons and information displays that take place in one of the corners of the map area. The most well-known are probably the [+] and [-] zoom buttons as well as the attribution information. Plenty of others are possible and we have made a few easy to add and directly accessible from the Map constructor options:
-
navigationControl- Shows the
[+],[-]and tilt/bearing/compass buttons - a boolean or a corner position. Showing on the top-right by default. Hidden if
false.
- Shows the
-
geolocateControl- Shows an arrow-shaped locate button. When clicked, it adds a marker and centers the map. If clicked again, the marker disappears (unless the map was moved since first clicked)
- a boolean or a corner position. Showing on the top-right by default. Hidden if
false.
-
terrainControl- Shows a button to enable/disable the 3D terrain (does not tilt the map)
- a boolean or a corner position. Hidden by default, showing on top-right if
true.
-
scaleControl- Shows a distance scale. The unit (
"metric","imperial"or"nautical") can be set in the config objectconfig.unit(default:"metric") - a boolean or a corner position. Hidden by default, showing on bottom-right if
true.
- Shows a distance scale. The unit (
-
fullscreenControl- Shows a button that toggles the map into fullscreen
- a boolean or a corner position. Hidden by default, showing on top-right if
true.
The corner positions possible are:
"top-left""top-right""bottom-left""bottom-right"
Example:
import { Map } from "@maptiler/sdk";

const map = new Map({
  container: document.getElementById("my-container-div"),
  terrainControl: false,
  scaleControl: true,
  fullscreenControl: "top-left",
})


Do you want to enable 3D terrain? That's easy now with a single function call:
// With the default exaggeration factor of 1
map.enableTerrain();

// Or, if you want to boost some volume a little
map.enableTerrain(1.5);
The terrain can also be enabled directly from the Map constructor, with the options terrain (a boolean, false by default) and terrainExaggeration (a number, 1 by default):
const map = new Map({
  // some options...
  terrain: true,
  terrainExaggeration: 1.5,
})
At any point, you can modify the exaggeration factor:
map.setTerrainExaggeration(2);Or simply disable it:
map.disableTerrain()📣 Note: Keep in mind that setting an exaggeration factor at
0will result in the same result as disabling the elevation but that terrain RGB tiles will still be fetched in the background.
📣 Note 2: please be aware that due to the volume and elevation of the map floor in 3D space, the navigation with the terrain enabled is slightly different than without.
By default, enabling, disabling or even just updating the terrain exaggeration will result in a 1-second animation. This is possible to modify with the following Map method:
// Duration in milliseconds
map.setTerrainAnimationDuration(500);-
"terrain"event
As an extension of Maplibre GL JS, MapTiler SDK is also exposing the terrain event "terrain". This event is triggered when a terrain source is added or removed:
map.on("terrain", (e) => {
  // your logic here
})
Since MapTiler SDK adds animation and the terrain data is necessary all along, the "terrain" event will be called at the very beginning of the terrain animation when enabling and at the very end when disabling.
-
"terrainAnimationStart"and"terrainAnimationStop"events
With the animation of the terrain, it can sometimes be convenient to know when the animation starts and ends. These two events are made just for that, here are how they work:
map.on("terrainAnimationStart", (event) => {
  console.log("Terrain animation is starting...");
});

map.on("terrainAnimationStop", (event) => {
  console.log("Terrain animation is finished");
});
The event argument is an object that contains (among other things) a terrain attribute. In the case of "terrainAnimationStop", this terrain attribute is null if the animation was about disabling the terrain, otherwise, this is just a propagation of map.terrain.
In the following example, we decide to associate the terrain animation with a change of camera, e.g. from clicking on the terrain control:
- when the terrain is enabled, it pops up with an animation and only then the camera is animated to take a lower point of view
- when the terrain is disabled, it is flattened with an animation and only then the camera is animated to a top view
map.on("terrainAnimationStop", (e) => {
  map.easeTo({
    pitch: e.terrain ? 60 : 0,
    duration: 500,
  });
});The language generally depends on the style but we made it possible to easily set and update from a built-in list of languages.
The built-in list of supported languages is accessible from the Language object:
import { Language } from "@maptiler/sdk";In the UMD bundle, it will be directly at maptilersdk.Language.
There are three distinct ways to set the language of a map:
- Global way, using the config object:
import { config } from "@maptiler/sdk";

config.primaryLanguage = Language.ENGLISH;
Then, if any further language setting is applied, all the map instances created afterward will use this language.
- Set the language at instantiation time:
const map = new Map({
  // some options...
  language: Language.ENGLISH, // the ISO codes can also be used (eg. "en")
})
It will only apply ENGLISH as the language of this specific map instance (and will not alter the global config).
- Set the language after the map has been instantiated:
map.setLanguage(Language.ENGLISH);Again, it will only apply ENGLISH as the language of this specific map instance (and will not alter the global config).
The list of supported languages is built-in and can be found here. In addition, there are special language flags:
-
Language.AUTO[DEFAULT] uses the language defined in the web browser -
Language.STYLE_LOCKto strictly use the language defined in the style. Prevents any further language update -
Language.LOCALuses the language local to each country -
Language.LATINuses a default with Latin characters -
Language.NON_LATINuses a default with non-Latin characters
Whenever a label is not supported in the defined language, it falls back to Language.LOCAL.
Here is a sample of some compatible languages:

Languages that are written right-to-left such as Arabic and Hebrew are fully supported by default. No need to install any plugins!


The visitor language modes are special built-in modes made to display labels in two different languages, concatenated when available:
-
Language.VISITORconcatenates labels in the language of your system and the local language -
Language.VISITOR_ENGLISHconcatenates labels in English and the local language
const map = new Map({
  // some options...
  language: Language.VISITOR,
})

// or

const map = new Map({
  // some options...
  language: Language.VISITOR_ENGLISH,
})
We believe these two modes can be very handy to help the end users identify places, especially when the local labels are not using a latin charset. Here is how it looks like:


The ready event happens just after the load event but waits until all the controls managed by the Map constructor are dealt with, some having an asynchronous logic to set up.
Since the ready event waits until all the basic controls are nicely positioned, it is safer to use ready than load if you plan to add other custom controls with the .addControl() method.
This event works exactly the same way as load and you can safely replace those by "ready". Here is a usage example:
const map = new maptilersdk.Map({
  container: "map-container",
});

map.on("ready", (evt) => {
  const terrainControl = new maptilersdk.MaptilerTerrainControl();
  map.addControl(terrainControl);
})
The loadWithTerrain event is triggered only once in a Map instance lifecycle, when both the ready event and the terrain event with non-null terrain are fired.
Why a new event?
When a map is instantiated with the option terrain: true, then MapTiler terrain is directly added to it and some animation functions such as .flyTo() or .easeTo() if started straight after the map initialization will actually need to wait a few milliseconds that the terrain is properly initialized before running.
Relying on the ready or load event to run an animation with a map with terrain may fail in some cases for this reason, and this is why waiting for loadWithTerrain is safer in this particular situation.
The events load, ready and loadWithTerrain are both called at most once and require a callback function to add more elements such as markers, layers, popups and data sources. Even though MapTiler SDK fully supports this logic, we have also included a promise logic to provide a more linear and less nested way to wait for a Map instance to be usable. Let's compare the two ways:
- Classic: with a callback on the
loadevent:
function init() {

  const map = new Map({
    container,
    center: [2.34804, 48.85439], // Paris, France
    zoom: 14,
  });

  // We wait for the event.
  // Once triggered, the callback is ran in its own scope.
  map.on("load", (evt) => {
    // Adding a data source
    map.addSource('my-gps-track-source', {
      type: "geojson",
      data: "https://example.com/some-gps-track.geojson",
    });
  })
}- Modern: with a promise returned by the method
.onLoadAsync(), used in anasyncfunction:
async function init() {

  const map = new Map({
    container,
    center: [2.34804, 48.85439], // Paris, France
    zoom: 14,
  });

  // We wait for the promise to resolve.
  // Once triggered, the rest of the init function runs
  await map.onLoadAsync();

  // Adding a data source
  map.addSource('my-gps-track-source', {
    type: "geojson",
    data: "https://example.com/some-gps-track.geojson",
  });
}
We deployed exactly the same logic for the loadWithTerrain event. Let's see how the two ways compare.
- Classic: with a callback on the
loadWithTerrainevent:
function init() {

  const map = new Map({
    container,
    center: [2.34804, 48.85439], // Paris, France
    zoom: 14,
    terrain: true,
  });

  // We wait for the event.
  // Once triggered, the callback is ran in its own scope.
  map.on("loadWithTerrain", (evt) => {
    // make an animation
    map.flyTo({
      center: [-0.09956, 51.50509], // London, UK
      zoom: 12.5,
    })
  })
}- Modern: with a promise returned by the method
.onLoadWithTerrainAsync(), used in anasyncfunction:
async function init() {

  const map = new Map({
    container,
    center: [2.34804, 48.85439], // Paris, France
    zoom: 14,
    terrain: true,
  });

  // We wait for the promise to resolve.
  // Once triggered, the rest of the init function runs
  await map.onLoadWithTerrainAsync();

  // make an animation
  map.flyTo({
    center: [-0.09956, 51.50509], // London, UK
    zoom: 12.5,
  })
}
And finally, the lifecycle method corresponding to the ready event:
- Classic: with a callback on the
readyevent:
function init() {

  const map = new Map({
    container,
    center: [2.34804, 48.85439], // Paris, France
    zoom: 14,
  });

  // We wait for the event.
  // Once triggered, the callback is ran in its own scope.
  map.on("ready", (evt) => {
    // Adding a data source
    map.addSource('my-gps-track-source', {
      type: "geojson",
      data: "https://example.com/some-gps-track.geojson",
    });
  })
}- Modern: with a promise returned by the method
.onReadyAsync(), used in anasyncfunction:
async function init() {

  const map = new Map({
    container,
    center: [2.34804, 48.85439], // Paris, France
    zoom: 14,
  });

  // We wait for the promise to resolve.
  // Once triggered, the rest of the init function runs
  await map.onReadyAsync();

  // Adding a data source
  map.addSource('my-gps-track-source', {
    type: "geojson",
    data: "https://example.com/some-gps-track.geojson",
  });
}
We believe that the promise approach is better because it does not nest scopes and will allow for a linear non-nested stream of execution. It also corresponds to more modern development standards.
📣 Note: Generally speaking, promises are not a go to replacement for all event+callback and are suitable only for events that are called only once in the lifecycle of a Map instance. This is the reason why we have decided to provide a promise equivalent only for the
load,readyandloadWithTerrainevents but not for events that may be called multiple time such as interaction events.
The map is rendered with WebGL, that leverages the GPU to provide high-performance graphics. In some cases, the host machine, operating system or the graphics driver, can decide that continuing to run such high performance graphics is unsustainable, and will abort the process. This is called a "WebGL context loss". Such situation happens when the resources are running low or when multiple browser tabs are competing to access graphics memory.
The best course of action in such situation varies from an app to another. Sometimes a page refresh is the best thing to do, in other cases, instantiating a new Map dynamically at application level is more appropriate because it hides a technical failure to the end user. The event webglContextLost is exposed so that the most appropriate scenario can be implemented at application level.
Here is how to respond to a WebGL context loss with a simple page refresh:
// Init the map
const map = new maptilersdk.Map({
  container: "map-container",
  hash: true,
})

// Refresh the page if context is lost.
// Since `hash` is true, the location will be the same as before
map.on("webglContextLost", (e) => {
  location.reload();
})A color ramp is a color gradient defined in a specific interval, for instance in [0, 1], and for any value within this interval will retrieve a color. They are defined by at least a color at each bound and usually additional colors within the range.
Color ramps are super useful to represent numerical data in a visual way: the temperature, the population density, the average commute time, etc.
The SDK includes many built-in ready-to-use color ramps as well as extra logic to manipulate them and create new ones, here is the full list:

To use an already existing color ramp and access some of its values:
import { ColorRampCollection } from "@maptiler/sdk";

// The TURBO color ramp, just like all the built-ins, is defined in [0, 1],
// but we can rescale it to fit the range of temperature [-18, 38]°C (equivalent to [0, 100]F)
// and this actually creates a clone of the original TURBO
const temperatureTurbo = ColorRampCollection.TURBO.scale(-18, 38);

// What's the color at 0°C (or 32F) ?
const zeroColor = temperatureTurbo.getColor(0);
// The color is an array: [45, 218, 189, 255]

// Alternatively, we can ask for the hex color:
const zeroColorHex = temperatureTurbo.getColorHex(0);
// The color is a string: "#2ddabdff"
Creating a new one consists of defining all the colors for each color stops. The values can be in the range of interest and do not have to be in [0, 1]. For example, let's recreate a Viridis color ramp but with a range going from 0 to 100:
import { ColorRamp } from "@maptiler/sdk";

const myCustomRamp = new ColorRamp({
  stops: [
    { value: 0, color: [68, 1, 84] },
    { value: 13, color: [71, 44, 122] },
    { value: 25, color: [59, 81, 139] },
    { value: 38, color: [44, 113, 142] },
    { value: 5, color: [33, 144, 141] },
    { value: 63, color: [39, 173, 129] },
    { value: 75, color: [92, 200, 99] },
    { value: 88, color: [170, 220, 50] },
    { value: 100, color: [253, 231, 37] },
  ]
});
When defining a new ramp, the colors can be an RGB array ([number, number, number]) or an RGBA array ([number, number, number, number]).
Many methods are available on color ramps, such as getting the <canvas> element of it, rescaling it, flipping it or resampling it in a non-linear way. Read more on our reference page and have a look at our examples to see how they work.
Let's make vector layers easy! Originally, you'd have to add a source and then proceed to the styling of your layer, which can be tricky because there are a lot of paint and layout options and they vary a lot from one type of layer to another. But we have helpers for this! 🖋️

Helpers come with a lot of built-in defaults and some fail-proof logic that makes creating vector layers much easier! As a result, a dataset can be displayed in one call, creating both the datasource and the layer(s) in one go!
Depending on the type of feature to add (point, polyline, polygon or heatmap), a different helper function needs to be used, but datasource could contain mixed types of feature and the helper will only display a specific type.
All the helpers are made available under the helpers object. If you are using ES Modules, this is how you access them:
import { Map, helpers } from "@maptiler/sdk";If you are using the UMD bundle of the SDK, for example from our CDN, you will find the helpers with:
maptilersdk.helpersExample: we have a geoJSON file that contains both polygons and point and we use it as the data property on the helpers.addPoint(map, { options }), this will only add the points.
In addition to easy styling, the helpers' datasource can be:
- a URL to a geoJSON file or its string content
- a URL to a GPX or KML file (only for the polyline helper) or its string content
- a UUID of a MapTiler Cloud dataset
The key design principle of these vector layer helpers is it's easy to make what you want, which is very different from making MapLibre easier to use.
For example, to create a road with an outline, one must draw two layers: a wider base layer and a narrower top layer, fueled by the same polyline data. This requires ordering the layers properly and computing not the width of the outline, but rather the width of the polyline underneath so that it outgrows the top road layer of the desired number of pixels.
With the polyline helper, you just say if you want an outline and specify its size (or even a zoom-dependent size) and everything is handled for you. As a result, calling the method helpers.addPolyline will return an object with multiple IDs: the ID of the top/main layer, the ID of the outline layer (could be null) and the ID of the data source. This makes further layer and source manipulation possible.
The vector layer helper also shares some I/O logic: each of them can take many options but a subset of them is common across all the helpers:
/**
 * A geojson Feature collection or a URL to a geojson or the UUID of a MapTiler Cloud dataset.
 */
data: FeatureCollection | string;

/**
 * ID to give to the layer.
 * If not provided, an auto-generated ID of the for "maptiler-layer-xxxxxx" will be auto-generated,
 * with "xxxxxx" being a random string.
 */
layerId?: string;

/**
 * ID to give to the geojson source.
 * If not provided, an auto-generated ID of the for "maptiler-source-xxxxxx" will be auto-generated,
 * with "xxxxxx" being a random string.
 */
sourceId?: string;

/**
 * The ID of an existing layer to insert the new layer before, resulting in the new layer appearing
 * visually beneath the existing layer. If this argument is not specified, the layer will be appended
 * to the end of the layers array and appear visually above all other layers.
 */
beforeId?: string;

/**
 * Zoom level at which it starts to show.
 * Default: `0`
 */
minzoom?: number;

/**
 * Zoom level after which it no longer show.
 * Default: `22`
 */
maxzoom?: number;The method helpers.addPolyline is not only compatible with the traditional GeoJSON source but also with GPX and KML files and the .data options can be a MapTiler Cloud dataset UUID and will be resolved automatically.
here is the minimal usage, with the default line width and a random color (within a selected list):
helpers.addPolyline(map, {
  // A URL, relative or absolute
  data: "some-trace.geojson",
});
We can add many options, such as specific color, a custom width or a dash pattern, this time sourcing the data from MapTiler Cloud, using the UUID of a dataset:
helpers.addPolyline(map, {
  data: "74003ba7-215a-4b7e-8e26-5bbe3aa70b05",
  lineColor: "#FF6666",
  lineWidth: 4,
  lineDashArray: "____ _ ",
  lineCap: "butt",
});
As you can see, we've come up with a fun and easy way to create dash arrays, just use underscores and white spaces and this pattern will repeat!
Adding an outline is also pretty straightforward:
helpers.addPolyline(map, {
  data: "74003ba7-215a-4b7e-8e26-5bbe3aa70b05",
  lineColor: "#880000",
  outline: true,
});
Endless possibilities, what about a glowing wire?
helpers.addPolyline(map, {
  data: "74003ba7-215a-4b7e-8e26-5bbe3aa70b05",
  lineColor: "#fff",
  lineWidth: 1,
  outline: true,
  outlineColor: "#ca57ff",
  outlineWidth: 10,
  outlineBlur: 10,
  outlineOpacity: 0.5,
});
All the other options are documented on our reference page and more examples are available here.
The polygon helper makes it easy to create vector layers that contain polygons, whether they are multipolygons, holedpolygons or just simple polygons. Whenever it's possible and it makes sense, we use the same terminology across the different helpers.
Here is a minimalist example, with a half-transparent polygon of Switzerland, from a local file:
helpers.addPolygon(map, {
  data: "switzerland.geojson",
  fillOpacity: 0.5,
});
Again, if no color is specified, a random one from a list is being picked:
![]()
Plenty of options are available to create interesting thematic visualizations:
helpers.addPolygon(map, {
  data: "switzerland.geojson",
  pattern: "cheese512.png",
  outline: true,
  outlineWidth: 3,
  outlineColor: "white",
  outlineDashArray: "_ ",
  fillOpacity: 0.7,
});
All the other options are documented on our reference page and more examples are available here.
A point visualization may appear like the simplest of all, but we noticed this is where people get the most creative: cluster, data-driven variable radius, but also scaled with zoom, with or without labels, data-driven colors, etc. Our helper supports all of these and will fill-in with built-in default for what's missing.
Here is the simplest example, with a dataset loaded from a local file:
helpers.addPoint(map, {
  data: "public-schools.geojson",
})
if no color is specified, a random color is used and the default radius is ramped over the zoom level:

Here is the same dataset, but with point clustering enabled:
helpers.addPoint(map, {
  data: "public-schools.geojson",
  cluster: true,
});
On the other hand, if clusters are enabled, the default color is fueled by the color ramp TURBO scaled from 10 to 10000 non-linearly resampled with the method "ease-out-square". The size also varies from minPointradius (default: 10) to maxPointRadius (default: 50):

With the point helper, it's also possible to adapt the color and the radius based on a property. In the following example, we display a point for each public school, with the scaling factor being the number of students:
helpers.addPoint(map, {
  data: "public-schools.geojson",
  property: "students",
  pointColor: ColorRampCollection.PORTLAND.scale(200, 2000).resample("ease-out-sqrt"),
  pointOpacity: 0.8,
  minPointRadius: 6,
  maxPointRadius: 30,
  showLabel: true,
  zoomCompensation: false,
})
Here, thePORTLAND color ramp is going to be used so that schools with 200 students or less will have the colors at the very beginning of the color ramp and schools with 2000 or more will have the color defined at the very end. Schools in between will be attributed a color in a non-linear fashion, following the "ease-out-sqrt" method (read Color Ramps section above for more info).
All the other options are documented on our reference page and more examples are available here.
The heatmap layer is a great alternative for visualizing a collection of sparse data, but it can be challenging to use, especially when one has to come up with their own color ramp from scratch. The helper makes this much easier!
Here is a minimalist example, using the default built-in TURBO color ramp:
helpers.addHeatmap(map, {
  data: "public-schools.geojson",
});
Some visualizations are created with a fixed geographic extent or zoom level in mind, whether it's a survey at the scale of a single neighborhood or statistics at a country scale. In this case, we want to tailor the color, radius, weight and intensity of the heatmap blobs exactly for these precise settings. In the following example, we disable the zoom compensation to make sure radio and intensity are never zoom-dependant:
helpers.addHeatmap(map, {
  data: "public-schools.geojson",
  property: "students",
  // radius: how wide are the blobs
  radius: [
    {propertyValue: 100, value: 15},
    {propertyValue: 800, value: 50},
  ],
  // weight: how intense are the blob, as fueled by a property
  weight: [
    {propertyValue: 100, value: 0.1},
    {propertyValue: 800, value: 1},
  ],
  // A custom color ramp, must be used with its default interval of [0, 1]
  colorRamp: ColorRampCollection.MAGMA,
  zoomCompensation: false,
  opacity: 0.6,
  // a global factor applied to all the blobs, regardless of the property or zoom
  intensity: 1.2,
});
Turning off zoom compensation allows for more accurate adjustments to the visualization at a specific zoom level, but it may not adapt as smoothly when zooming in or out.
All the other options are documented on our reference page and more examples are available here.
In the Polyline helper section above, we have seen that one can feed the helper directly with a path to a GPX or KML file, that is then converted under the hood client-side into a GeoJSON FeatureCollection object. This conversion feature is also exposed and can be used as such:
import { gpx } from "@maptiler/sdk";

// ... assuming inside an async function

// Fetching the GPX file as a string:
const gpxFilePath = "some_gps_trace.gpx";
const gpxResponse = await fetch(gpxFilePath);
const gpxStr = await res.text();

// Converting the GPX payload into a GeoJSON FeatureCollection:
const features = maptilersdk.gpx(gpxStr);
And for KML files:
import { kml } from "@maptiler/sdk";

// ... assuming inside an async function

// Fetching the KML file as a string:
const kmlFilePath = "some_gps_trace.kml";
const kmlResponse = await fetch(kmlFilePath);
const kmlStr = await res.text();

// Converting the KML payload into a GeoJSON FeatureCollection:
const features = maptilersdk.gpx(kmlStr);There are two different ways to create screenshot, corresponding to two very different usecases. Note that screenshots will not contain DOM elements such as Marker and Popup, since those are not part of the rendering context.
1. Get a blob of a screenshot, PNG encoded:
import { Map, helpers } from "@maptiler/sdk";

// ... initialize a Map instance, wait for the "load" or "ready" event ...

// Inside an async function, or with using .then()
const blob = await helpers.takeScreenshot(map);
The returned Blob of a PNG image file can be very handy if the goal is to programmatically further manipulate the screenshot, such as sending it to some feedback endpoint with a POST request.
2. Download a PNG file:
import { Map, helpers } from "@maptiler/sdk";

// ... initialize a Map instance, wait for the "load" or "ready" event ...

// No need to be inside an async function, the download will be triggered when the file is ready
maptilersdk.helpers.takeScreenshot(map, {
  download: true,
  filename: "map_screenshot.png"
});
Getting a file directly is a nice option that can be useful to share some debugging context with colleagues, compare multiple styles, or share your creation on social media.
📣 Note: Keep in mind that MapTiler Cloud data are copyrighted and their usage is restricted. This include MapTiler built-in styles and tilesets, among others. In case of doubt, do not hesitate to read our terms or to ask our support team.
Starting from v2, MapTiler SDK introduced the caching of tiles and fonts served by MapTiler Cloud, which can represent a large chunk of the data being fetched when browsing a map. This caching leverages modern browsers caching API so it's well-managed and there is no risk of bloating! When we update MapTiler Planet or our official styles, the caching logic will detect it and automatically invalidate older versions of the tiles that were previously cached.
Caching greatly improves the performance at load time and positively impacts the user experience, for this reason, it is enabled by default. If for debugging purposes or for a very specific use-case caching needs to be disabled, then it is possible:
import { config } from "@maptiler/sdk";

config.caching = false;Our map SDK is not only about maps! We also provide plenty of wrappers to our API calls!
📣 Note: If you need only the API Client library to use in a headless fashion and without any map display, check out out API Client library for browser and NodeJS. It's exactely what is down below and only that, in a minimalistic TypeScript package 🐙.
✅ Please, use geocoding functions only from client-side (browser) and do not 🚫 store or redistribute MapTiler Cloud API data. In case of doubt, consult the terms ⚖️
You want to know the longitude and latitude of a specific place, use the forward geocoding:
// in an async function, or as a 'thenable':
const result = await maptilersdk.geocoding.forward('paris');
You can provide some options such as:
- the proximity, given a lon-lat position, to sort the results
- one of more languages to get the results into
- a bounding geo box, to restrict the search to a given window
Read more about forward geocoding on our official documentation.
You want to know the name of a place, given a longitude-latitude? Use the reverse geocoding:
// in an async function, or as a 'thenable':
const result = await maptilersdk.geocoding.reverse([6.249638, 46.402056]);
The same option object as the forward geocoding can be provided.
Read more about reverse geocoding on our official documentation.
For both forward and reverse geocoding, this library provides a list of supported languages as shorthands to ISO language codes. The result will be provided in multiple languages if the language option is an array:
const result = await maptilersdk.geocoding.forward('paris', {language: [maptilersdk.geocoding.languages.SPANISH, maptilersdk.geocoding.languages.KOREAN]})The special language AUTO will detect the platform/browser preferred language.
The geolocation service provides location information of a visitor using its IP address.
The geolocation uses the IP address of a visitor to provide information about their location, such as city, region, country, timezone, etc. The precision is lower than GPS but does not require visitors to explicitly enable the location service from their web browser.
There is only a single function:
// in an async function, or as a 'thenable':
const result = await maptilersdk.geolocation.info();
Read more about geolocation on our official documentation.
If you are already familiar with epsg.io (created by MapTiler), then you may find it convenient to access the details of more than 10 thousands coordinate reference systems (CRS) programmatically, as well as transform coordinates from one system to another!
The search lets you perform a query in a free-form fashion. Here are some examples:
// in an async function, or as a 'thenable':
const resultA = await maptilersdk.coordinates.search('mercator');
const resultB = await maptilersdk.coordinates.search('plate carree');
const resultC = await maptilersdk.coordinates.search('france');
const resultD = await maptilersdk.coordinates.search('code:4326', {transformations: true}));
The transformations options retrieve a lot more details about the CRS that MapTiler API is able to transform to/from than just their IDs.
Read more about searching coordinate systems on our official documentation.
Transforming a couple of coordinates from one system to another can be challenging, for example, most countries have their own official system, yet web mapping tools are more often than not exclusive to WGS84.
If not provided, both the source (sourceCrs) and the destination (`targetCrs) are defaulted to EPSG:4326** (in other words, WGS84). Here is how to use this feature:
// in an async function, or as a 'thenable':

// Providing one coordinate to transform, with a target CRS being EPSG:9793 (RGF93 v2 / Lambert-93, France official CRS)
const resultA = await maptilersdk.coordinates.transform([1, 45], {targetCrs: 9793})

// Using the same logic, we can pass up to 50 coordinates to be transformed
const resultB = await maptilersdk.coordinates.transform([[10, 48], [1, 45]], {targetCrs: 9793})
Read more about transforming coordinates on our official documentation.
MapTiler Cloud gives its users the possibility to upload and create data, manually with a user interface or by uploading a GPX, GeoJSON, KML or shp file. A unique ID is associated with each dataset so that we can later access it programmatically to retrieve a GeoJSON equivalent of it:
// in an async function, or as a 'thenable':
const result = await maptilersdk.data.get('my-dataset-unique-id')
Since the result is a GeoJSON, it can easily be added to a map with .addSource() and .addLayer().
Read more about fetching your own data on our official documentation.
✅ Please, use static maps URLs only from client side
<img>elements, and do not 🚫 store or redistribute the static map files. In case of doubt, consult the terms ⚖️
Maptiler Cloud provides many possibilities for creating static maps as PNG, JPEG or WebP images. They all offer the possibilities to:
- Choose from one of the MapTiler styles or your own
- Add markers with a custom icon (or default icon with a custom color)
- Add a path or polygon, with a parametric line width and color and a parametric filling color
Three modes are available: centered, bounded and automatic.
📣 important: only image URLs are returned.
Contrary to the other functions of this library, the static map functions do not perform any query to MapTiler Cloud API, instead they build the image URL for you to use in<img>elements.
In the following static map functions, the option object features a style property that can be a string or one of the built-in style shorthand. Here is the full list:
-
MapStyle.STREETS, reference style for navigation and city exploration-
MapStyle.STREETS.DARK(variant) -
MapStyle.STREETS.LIGHT(variant) -
MapStyle.STREETS.NIGHT(variant) -
MapStyle.STREETS.PASTEL(variant)
-
-
MapStyle.OUTDOORreference style for adventure-
MapStyle.OUTDOOR.DARK(variant)
-
-
MapStyle.WINTERreference style for winter adventure-
MapStyle.WINTER.DARK(variant)
-
-
MapStyle.SATELLITEreference style satellite and airborne imagery (no variants) -
MapStyle.HYBRIDreference style satellite and airborne imagery with labels (no variants) -
MapStyle.BASICreference style for minimalist design and general purpose-
MapStyle.BASIC.DARK(variant) -
MapStyle.BASIC.LIGHT(variant)
-
-
MapStyle.BRIGHTreference style for high-contrast navigation-
MapStyle.BRIGHT.DARK(variant) -
MapStyle.BRIGHT.LIGHT(variant) -
MapStyle.BRIGHT.PASTEL(variant)
-
-
MapStyle.TOPOreference style for topographic study-
MapStyle.TOPO.SHINY(variant) -
MapStyle.TOPO.PASTEL(variant) -
MapStyle.TOPO.TOPOGRAPHIQUE(variant)
-
-
MapStyle.VOYAGERreference style for stylish yet minimalist maps-
MapStyle.VOYAGER.DARK(variant) -
MapStyle.VOYAGER.LIGHT(variant) -
MapStyle.VOYAGER.VINTAGE(variant)
-
-
MapStyle.TONERreference style for very high contrast stylish maps-
MapStyle.TONER.BACKGROUND(variant) -
MapStyle.TONER.LITE(variant) -
MapStyle.TONER.LINES(variant)
-
-
MapStyle.OPENSTREETMAP(reference style, this one does not have any variants) -
MapStyle.STAGE, the perfect style for data visualization, with very little noise-
MapStyle.STAGE.DARK(variant) -
MapStyle.STAGE.LIGHT(variant)
-
This type of map is centered on a longitude-latitude coordinate and the zoom level must also be provided (from 0: very zoomed out, to 22: very zoomed in).
Note that if a path or markers are provided, the framing of the map will not automatically adapt to include those (use the automatic mode for that).
const imageLink = maptilersdk.staticMaps.centered(
  // center position (Boston)
  [-71.06080, 42.362114],

  // zoom level
  12.5,

  // Options
  {
    // Request a hiDPI/Retina image
    hiDPI: true,

    // Output image size
    width: 1000,
    height: 1000,

    // Map style
    style: maptilersdk.MapStyle.OUTDOOR,
  });
Read more about centered static maps on our official API documentation.
This type of map requires a bounding box made of two points: the south-west bound and the north-east bound. The zoom level cannot be provided and is automatically deduced from the size of the bounding box.
const imageLink = maptilersdk.staticMaps.bounded(
  // The bounding box on Europe
  [
    -24,  // west bound (min x)
    34.5, // south bound (min y)
    32,   // east bound (max x)
    71,   // north bound (max y)
  ],

  // Options
  {
    hiDPI: true,
    width: 2048,
    height: 2048,
    style: maptilersdk.MapStyle.STREETS.DARK,

    // Extra space that will add around the bounding box, in percentage
    // (0.1 = 10% is actually the dafault)
    padding: 0.1
  });
Since the zoom level cannot be provided, the level of details is dictated by the size of the output image. here is an example:
2048 x 2048 |
1024 x 1024 |
|---|---|
 |
 |
As you may notice, the geo bounding box could have very different proportions than the output image size. In the following example, we place the very same bounding box around Portugal, which has a this particular strip looking shape. We also add a path that repeats exactly the same bounding box to show the difference between the provided bounding box and the final image. We kept the default padding of 10%:
2048 x 2048 |
1024 x 2048 |
|---|---|
 |
 |
Read more about bounded static maps on our official API documentation.
As we have seen with centered and bounded maps, providing all the parameters is nice but can be cumbersome for the simplest use cases. This is why MapTiler Cloud also provides static maps that fit automatically whatever you need to place inside: path or markers.
In the following example, we are going to load a cycling track recorded by one of our team members in Montreal, Canada. The track, originally a GPX file, was pushed to MapTiler Data and is now made available as a GeoJSON:
// Fetching the GeoJSON
const bikeTrack = await maptilersdk.data.get('the-id-of-a-bike-track-in-montreal');

// Extracting the track points with the shape [[lng, lat], [lng, lat], ...]
const trackPoints = bikeTrack.features[0].geometry.coordinates[0]
  .map(p => p.slice(0, 2));

const imageLink = maptilersdk.staticMaps.automatic({
  // hiDPI/Retina precision
  hiDPI: true,

  // A fairly large output image
  width: 2048,
  height: 1024 ,

  // A grey style on which the track will pop!
  style: maptilersdk.MapStyle.STREETS.LIGHT,

  // Draw a path with the trackpoints
  path: trackPoints,

  // Adding a marker for the starting point, with a custom color (array of shape [lng, lat, color])
  markers: [trackPoints[0][0], trackPoints[0][1], '#0a0'],

  // Showing the track in red
  pathStrokeColor: 'red',
});
And voila!

📣 Note: The GeoJSON for this track contains 9380 couples of coordinates, which is a lot! In order to send the track to MapTiler Cloud static maps API, the client simplifies the long paths while keeping a high degree of precision using a very fast Ramer-Douglas-Peucker algorithm.
Read more about bounded static maps on our official API documentation.
With the elevation API, it's possible to get the elevation in meters from any location. It's possible to lookup and compute elevation for a single location, to provide a batch of points, from a GeoJSON LineString or a GeoJSON MultiLineString!
ℹ️ Under the hood, the elevation API is fueled by MapTiler Cloud's RGB Terrain raster tileset, which is a composite of many high-resolution DEMs from all over the world, currated and processed by our geodata team! The same dataset is also fueling our SDK's elevation (3D terrain) and the hillshading we use in many of our styles.
📣 Note for TypeScript users: internaly, the elevation feature relies on some GeoJSON types definitions that can be found in this NPM package:
@types/geojson. NamelyLineString,MultiLineStringandPosition. It may improve your developer experience to also use these types.
Let's see how to use it:
// Not mandatory, but it's to explain where the type comes from:
import { Position } from "geojson";

const montBlancPeak: Position = [6.864884, 45.832743];
const elevatedPosition = await maptilersdk.elevation.at(montBlancPeak);
The returned value is also a GeoJSON Position array, but with three elements: [lng, lat, elevation].
Read more about elevation lookup for a single location in our official documentation.
// Not mandatory, but it's to explain where the type comes from:
import { Position } from "geojson";

const peaks: Position[] = [
  [6.864884, 45.832743],   // Mont Blanc, Alps
  [86.9250, 27.9881],      // Mount Everest, Himalayas
  [-70.0109, -32.6532],    // Aconcagua, Andes
  [-151.0064, 63.0695],    // Denali, Alaska
  [37.3556, -3.0674],      // Mount Kilimanjaro
  [42.4453, 43.3499],      // Mount Elbrus, Caucasus
  [137.1595, -4.0784],     // Puncak Jaya, Sudirman Range
  [-140.4055, 60.5672],    // Mount Logan, Saint Elias Mountains
  [138.73111, 35.358055],  // Mount Fuji
];

const elevatedPeaks = await maptilersdk.elevation.batch(peaks);
Read more about elevation lookup for a batch of locations in our official documentation.
In the GeoJSON LineString case, it clones the entire structure and the position arrays of the clone will contain three elements: [lng, lat, elevation]. The original LineString is not mutated nor pointed at.
// Not mandatory, but it's to explain where the type comes from:
import { LineString } from "geojson";


const someLineString: LineString = {
  type: "LineString",
  coordinates: [[6.864884, 45.832743], [86.9250, 27.9881], [-70.0109, -32.6532]]
};

const someElevatedLineString = await maptilersdk.elevation.fromLineString(someLineString);
// someElevatedLineString is also of type LineString
Read more about elevation lookup for a LineString in our official documentation.
In the GeoJSON MultiLineString case, it clones the entire structure and the position arrays of the clone will contain three elements: [lng, lat, elevation]. The original MultiLineString is not mutated nor pointed at.
// Not mandatory, but it's to explain where the type comes from:
import { MultiLineString } from "geojson";


const someMultiLineString: MultiLineString = {
  type: "LineString",
  coordinates: [
    [[6.864884, 45.832743], [86.9250, 27.9881], [-70.0109, -32.6532]],
    [[-151.0064, 63.0695], [37.3556, -3.0674], [42.4453, 43.3499]],
    [[137.1595, -4.0784], [-140.4055, 60.5672], [138.73111, 35.358055]],
  ]
};

const someElevatedMultiLineString = await maptilersdk.elevation.fromMultiLineString(someMultiLineString);
// someElevatedMultiLineString is also of type MultiLineString
Read more about elevation lookup for a MultiLineString in our official documentation.
In order to increase performance while reducing unnecessary elevation data fetching, the elevation tiles are cached. This is particularly important for the LineString and MultiLineString lookups because GeoJSON data are likely to come from a recorded or planned route, where position points are very close to one another.
Some operations can be fairly repetitive: WGS84 to Mercator, WGS84 to zxy tile index, the distance between two points with the Haversine formula, etc. As a result, we have decided to expose a math package providing the most recurrent feature, so that, just like us at MapTiler, you no longer need to copy-paste the same function from your previous project!
The math package differs from the others in the sense that it does not call the MapTiler Cloud API, instead, it operates fully on the machine it's running on.
Here are some examples:
// Not mandatory, but it's to explain where the type comes from:
import { Position } from "geojson";

// Some constants
const earthRadius = maptilersdk.math.EARTH_RADIUS;
const earthCircumference = maptilersdk.math.EARTH_CIRCUMFERENCE;

const montBlancPeakWgs84: Position = [6.864884, 45.832743];

// From WGS84 to Mercator
const montBlancPeakMerc = maptilersdk.math.wgs84ToMercator(montBlancPeakWgs84); // also of type Position

// From Mercator to WGS84
const montBlancPeakWgs84Again = maptilersdk.math.mercatorToWgs84(montBlancPeakMerc);

// A great-circle distance in meter:
const from: Position = /* ... */;
const to: Position = /* ... */;
const distance = maptilersdk.math.haversineDistanceWgs84(from, to);

// Full distance of a route made of many positions
const route: Position[] = /* ... */;
const totalDistance = maptilersdk.math.haversineCumulatedDistanceWgs84(route);

// Lon lat to tile index, given a zoom level. An [x, y] array is returned
const tileXY = maptilersdk.math.wgs84ToTileIndex(montBlancPeakWgs84, 14);
// Possible to have floating point tile indices with a third argument to `false`

// and many more!
Please find out more about the math package in our official documentation:
The telemetry is very valuable to the team at MapTiler because it shares information about where to add the extra effort. It also helps spotting some incompatibility issues that may arise between the SDK and a specific version of a module.
It consists in sending metrics about usage of the following features:
- SDK version [string]
- API key [string]
- MapTiler sesion ID (if opted-in) [string]
- if tile caching is enabled [boolean]
- if language specified at initialization [boolean]
- if terrain is activated at initialization [boolean]
- if globe projection is activated at initialization [boolean]
In addition, each official module will be added to a list, alongside its version number.
Telemetry is enabled by default but can be opted-out by setting telemetry value of config to false.
import * as maptilersdk from '@maptiler/sdk';

maptilersdk.config.telemetry = false;