Box Plot SVG Graph
This is a simple Zero dependency implementation that generates a Box and Whisker plot based on the provided data summary and rendering it in a simple interactive SVG image that can be embedded into applications, website, documents, or whatever else your need may be.
For best results the values are placed dynamically based on the data summary values, this requires javascript to be run in order to place and ensure there is no overlapping, if this does not work for your use case you can turn this off with the staticLabels option
Examples
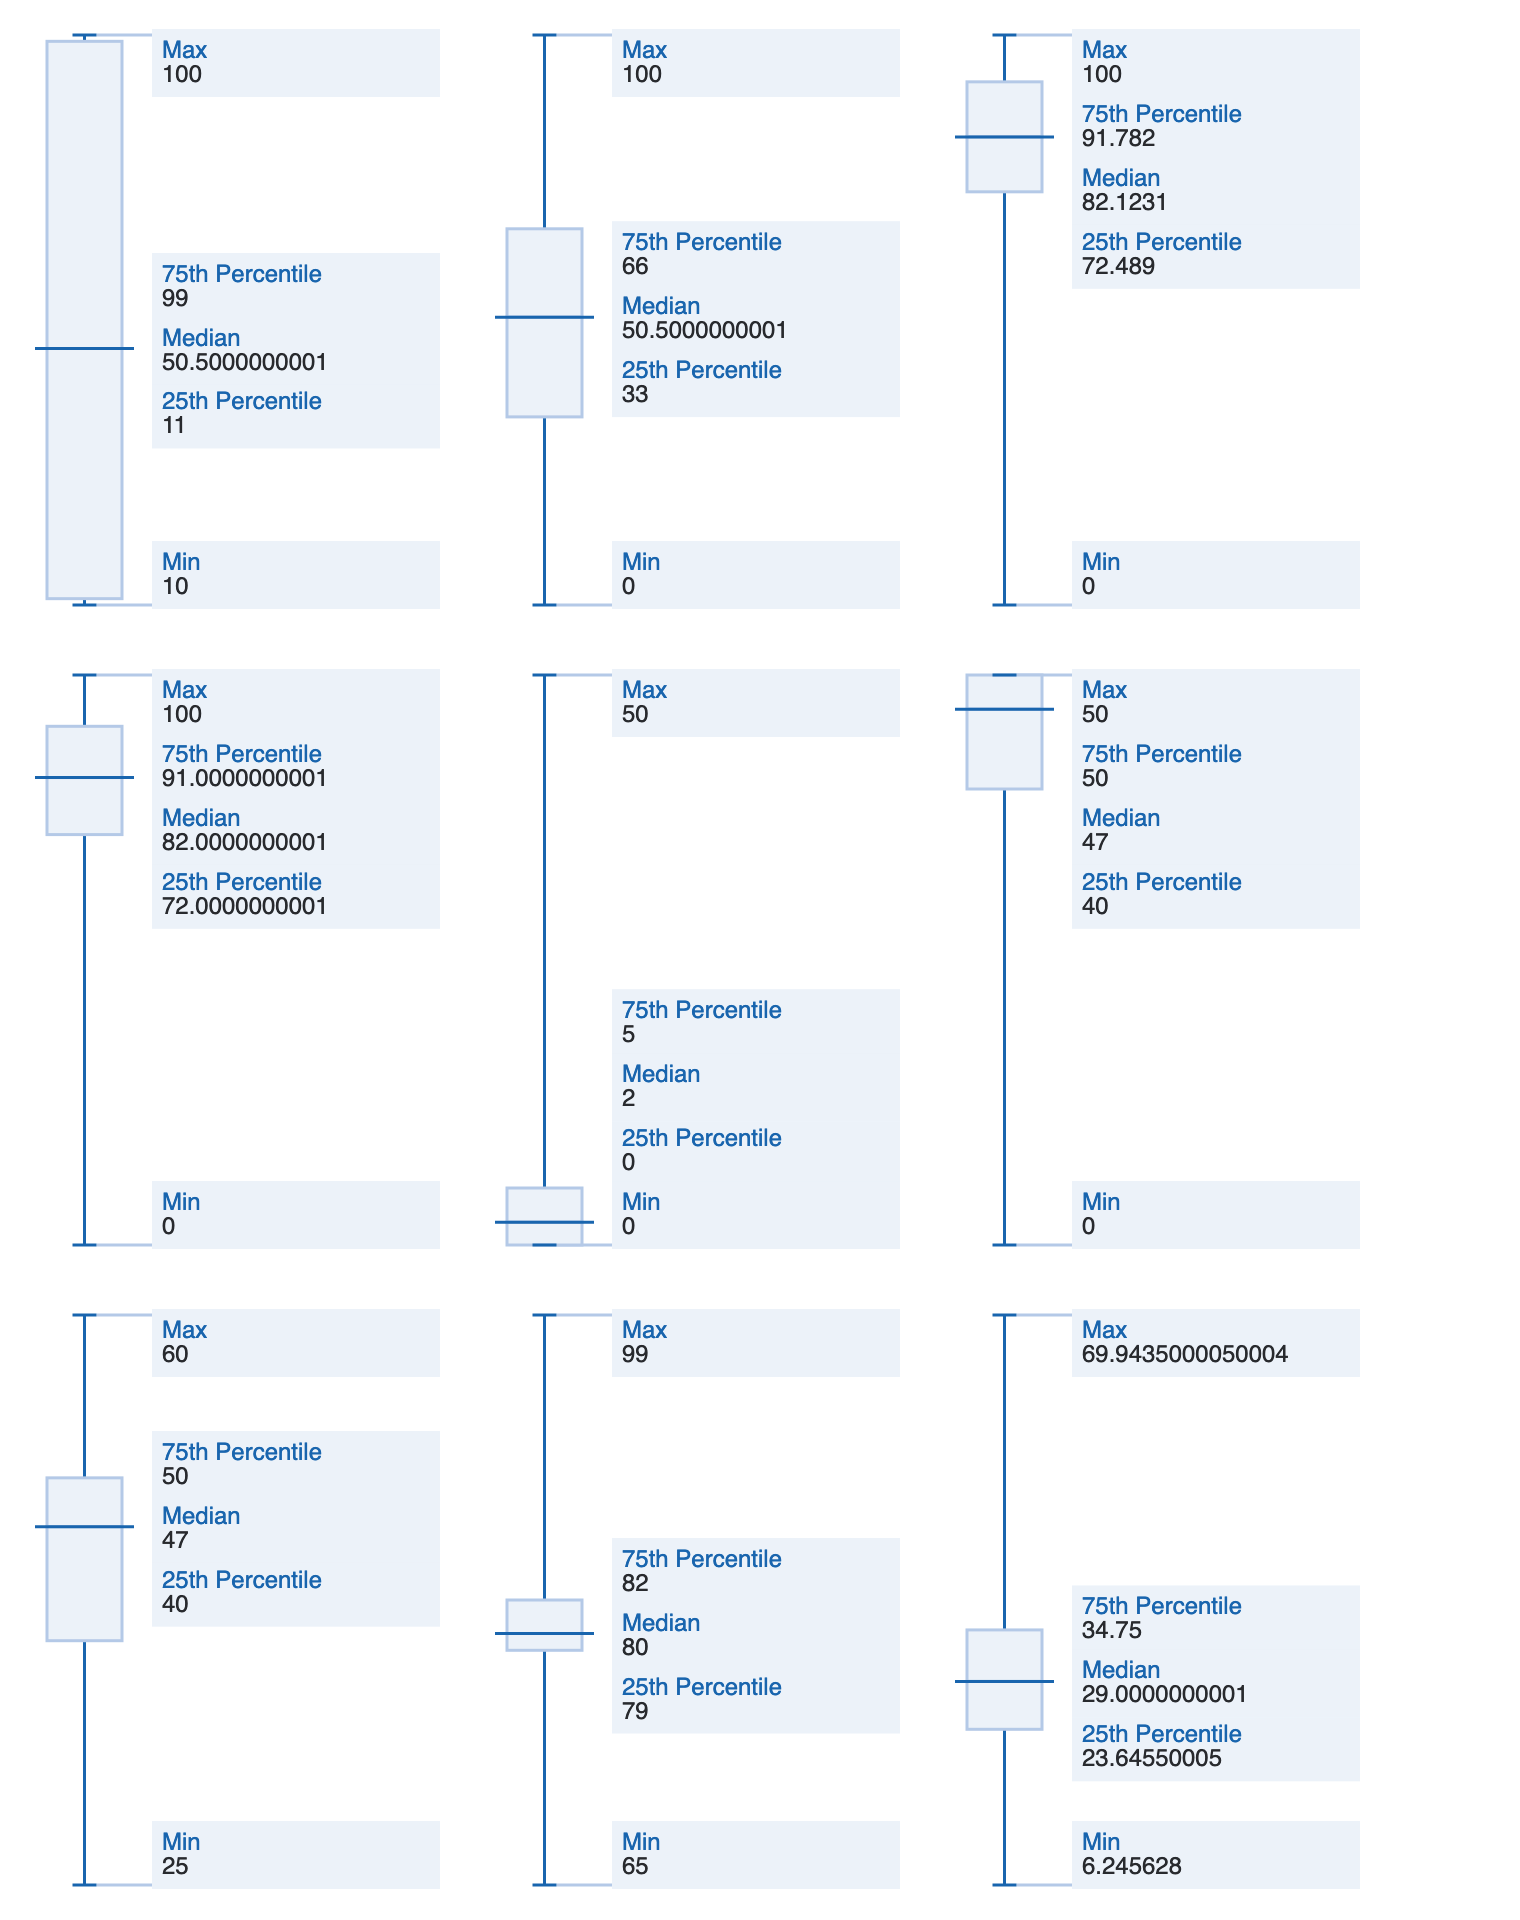
Below are a few SVG box plots that were generated from test.spec.js to refer to generation sample code
Quick Start
Simply add this package using npm or yarn
npm i @cplacke/box-plot-svg
yarn add @cplacke/box-plot-svg
Then you can generate an SVG string with by importing and using the createBoxPlotSVG function and passing the required box-plot data and config overrides if desired
const svg: string = createBoxPlotSVG({
    min: 10,
    max: 100.00,
    q3: 99,
    q1: 11,
    median: 50,
});
If the event functions do run as expected, or images are dynamically added then you may need to invoke this in code after the image has been rendered and size has been determined by using the exported functions as in the below example
const plotId = getId(svgString);
positionLabels(plotId, plotConfig);
Config Object
The default config for generating a box plot are below and can be modified to fit your needs, all units are in percent of total image
const defaultConfig = {
    padding: 2.5, // percentage
    boxWidth: 12.5, // percentage
    boxInset: 2, // percentage
    style: 'height: 100%;', // css rule(s)
    text: {
        size: 12, // pixels
        padding: 1, // pixels
        radius: 2,
        font: 'OptumSans, helvetica, sans-serif, monospace',
    },
    stroke: {
        box: 1.5,
        line: 1.5
    },
    color: {
        fill: '#ECF2F9',
        line: '#1965AE',
        border: '#B4C9E7',
        label: '#1965AE',
        fillHover: '#D7E5F6',
        lineHover: '#B4C9E7',
        text: '#282A2E',
    },
    inverted: true, // when true max renders at top
    staticLabels: false, // no dynamic positioning based on values or script run
}
Limitations
Currently there is no support for passing a direct array of data for quartiles to be calculated at runtime, this is a future enhancement if you would like to help make this project better. There is no support for outlier rendering as points beyond the min/max. The dynamic posistion of the labels happens at document load time with a script implementation, due to the mix of % units for spacing and px units for text sizing.
