
tracetool
Send debug, warning, error traces to an external windows tracetool viewer (located on the bin folder).
You MUST start the viewer before sending traces.
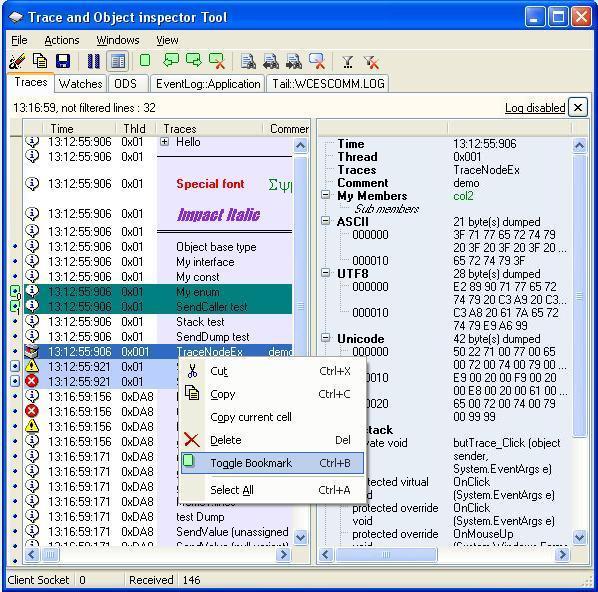
You can send basic traces, 2 columns traces, hierachical traces, objects , call stack, image, dump,... you can resend traces, create new pages on the viewer to separate business traces, Watches pages There is a lot of functions to manages traces on the viewer : delete, bookmark, set as current,...
The Api is compatible with NodeJs and on a browser (using a script or requireJs), so you can see all your traces on the same computer.
Tracetool is also available for Java , Dot Net, Silverlight, C++ , Delphi, Python and any system compatible with ActiveX (windows)
On the tracetool viewer, open the View/Options... menu, select the "framework" section , enable the HTTP port (used for javascript api) and give an UNUSED port like 81 This port need to be the same on your nodejs application
You can enter a comment on the "TraceTool Title" in the "general" section , like "Tracetool - Http port : 81" The viewer must be on a windows computer and your application on any system suporting nodejs like a raspberry Pi !
In your NodeJs Application, just give the Host and port before sending traces.
Usage
var ttrace = require('tracetool');
ttrace.host = '127.0.0.1:81';   // note that the default is already 127.0.0.1:81
ttrace.debug.send('hello', 'world') ;
ttrace.debug.send('Parent trace').send('Child trace') ;
A demo is available in the demo folder
See the Github site for all possibilities